Symantec 2011 Annual Report Download - page 109
Download and view the complete annual report
Please find page 109 of the 2011 Symantec annual report below. You can navigate through the pages in the report by either clicking on the pages listed below, or by using the keyword search tool below to find specific information within the annual report.-
 1
1 -
2
-
3
-
4
-
5
-
6
-
7
-
8
-
9
-
10
-
11
-
12
-
13
-
14
-
15
-
16
-
17
-
18
-
19
-
20
-
21
-
22
-
23
-
24
-
25
-
26
-
27
-
28
-
29
-
30
-
31
-
32
-
33
-
34
-
35
-
36
-
37
-
38
-
39
-
40
-
41
-
42
-
43
-
44
-
45
-
46
-
47
-
48
-
49
-
50
-
51
-
52
-
53
-
54
-
55
-
56
-
57
-
58
-
59
-
60
-
61
-
62
-
63
-
64
-
65
-
66
-
67
-
68
-
69
-
70
-
71
-
72
-
73
-
74
-
75
-
76
-
77
-
78
-
79
-
80
-
81
-
82
-
83
-
84
-
85
-
86
-
87
-
88
-
89
-
90
-
91
-
92
-
93
-
94
-
95
-
96
-
97
-
98
-
 99
99 -
 100
100 -
 101
101 -
 102
102 -
 103
103 -
 104
104 -
 105
105 -
 106
106 -
 107
107 -
 108
108 -
 109
109 -
 110
110 -
 111
111 -
 112
112 -
 113
113 -
 114
114 -
 115
115 -
 116
116 -
 117
117 -
 118
118 -
 119
119 -
120
-
121
-
122
-
123
-
124
-
125
-
126
-
127
-
128
-
129
-
130
-
131
-
132
-
133
-
134
-
135
-
136
-
137
-
138
-
139
-
140
-
141
-
142
-
143
-
144
-
145
-
146
-
147
-
148
-
149
-
150
-
151
-
152
-
153
-
154
-
155
-
156
-
157
-
158
-
159
-
160
-
161
-
162
-
163
-
164
-
165
-
166
-
167
-
168
-
169
-
170
-
171
-
172
-
173
-
174
-
175
-
176
-
177
-
178
 |
 |

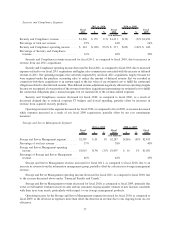
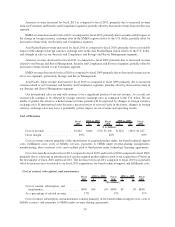
Americas revenue increased for fiscal 2011 as compared to fiscal 2010, primarily due to increased revenue
from our Consumer and Security and Compliance segments, partially offset by decreased revenue from our Services
segment.
EMEA revenue decreased for fiscal 2011 as compared to fiscal 2010, primarily due to an unfavorable impact of
the change in foreign currency exchange rates in the EMEA region relative to the U.S. dollar, partially offset by
increased revenue from our Security and Compliance segment.
Asia Pacific/Japan revenue increased for fiscal 2011 as compared to fiscal 2010, primarily due to a favorable
impact of the change in foreign currency exchange rates in the Asia Pacific/Japan region relative to the U.S. dollar,
and strength in sales in our Security and Compliance and Storage and Server Management segments.
Americas revenue decreased for fiscal 2010 as compared to fiscal 2009 primarily due to decreased revenue
related to our Storage and Server Management, Security and Compliance and Services segments, partially offset by
increased revenue related to our Consumer segment.
EMEA revenue decreased for fiscal 2010 as compared to fiscal 2009 primarily due to decreased revenue across
all of our segments, particularly Storage and Server Management.
Asia Pacific Japan revenue increased for fiscal 2010 as compared to fiscal 2009 primarily due to increased
revenue related to our Consumer and Security and Compliance segments, partially offset by decreased revenue in
our Storage and Server Management segment.
Our international sales are and will continue to be a significant portion of our net revenue. As a result, net
revenue will continue to be affected by foreign currency exchange rates as compared to the U.S. dollar. We are
unable to predict the extent to which revenue in future periods will be impacted by changes in foreign currency
exchange rates. If international sales become a greater portion of our total sales in the future, changes in foreign
currency exchange rates may have a potentially greater impact on our revenue and operating results.
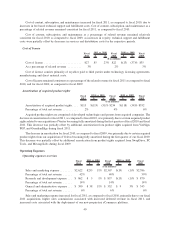
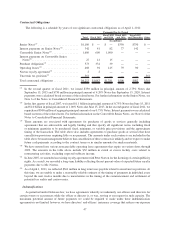
Cost of Revenue
Fiscal
2011 $ %
Fiscal
2010 $ %
Fiscal
2009
2011 vs. 2010 2010 vs. 2009
($ in millions)
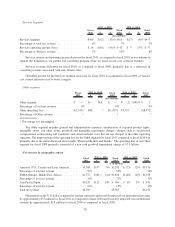
Cost of revenue ................. $1,045 $(60) (5)% $1,105 $(122) (10)% $1,227
Gross margin . . ................. 83% 82% 80%
Cost of revenue consists primarily of the amortization of acquired product rights, fee-based technical support
costs, fulfillment costs, costs of billable services, payments to OEMs under revenue-sharing arrangements,
manufacturing, direct material costs, and royalties paid to third parties under technology licensing agreements.
Cost of revenue decreased for fiscal 2011 compared to fiscal 2010, and for fiscal 2010 compared to fiscal 2009,
primarily due to a decrease in amortization of certain acquired product rights related to our acquisition of Veritas in
the first quarter of fiscal 2010 and fiscal 2011. The decrease for fiscal 2011 compared to fiscal 2010 was partially
offset by increases in costs related to our fiscal 2011 acquisitions, fee-based technical support, and fulfillment costs.
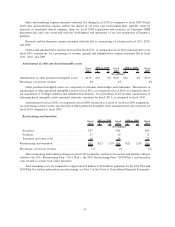
Cost of content, subscription, and maintenance
Fiscal
2011 $ %
Fiscal
2010 $ %
Fiscal
2009
2011 vs. 2010 2010 vs. 2009
($ in millions)
Cost of content, subscription, and
maintenance ...................... $903 $54 6% $849 $9 1% $840
As a percentage of related revenue ........ 17% 17% 17%
Cost of content, subscription, and maintenance consists primarily of fee-based technical support costs, costs of
billable services, and payments to OEMs under revenue-sharing agreements.
39