Symantec 2011 Annual Report Download - page 62
Download and view the complete annual report
Please find page 62 of the 2011 Symantec annual report below. You can navigate through the pages in the report by either clicking on the pages listed below, or by using the keyword search tool below to find specific information within the annual report.-
 1
1 -
2
-
3
-
4
-
5
-
6
-
7
-
8
-
9
-
10
-
11
-
12
-
13
-
14
-
15
-
16
-
17
-
18
-
19
-
20
-
21
-
22
-
23
-
24
-
25
-
26
-
27
-
28
-
29
-
30
-
31
-
32
-
33
-
34
-
35
-
36
-
37
-
38
-
39
-
40
-
41
-
42
-
43
-
44
-
45
-
46
-
47
-
48
-
49
-
50
-
51
-
 52
52 -
 53
53 -
 54
54 -
 55
55 -
 56
56 -
 57
57 -
 58
58 -
 59
59 -
 60
60 -
 61
61 -
 62
62 -
 63
63 -
 64
64 -
 65
65 -
 66
66 -
 67
67 -
 68
68 -
 69
69 -
 70
70 -
 71
71 -
 72
72 -
73
-
74
-
75
-
76
-
77
-
78
-
79
-
80
-
81
-
82
-
83
-
84
-
85
-
86
-
87
-
88
-
89
-
90
-
91
-
92
-
93
-
94
-
95
-
96
-
97
-
98
-
99
-
100
-
101
-
102
-
103
-
104
-
105
-
106
-
107
-
108
-
109
-
110
-
111
-
112
-
113
-
114
-
115
-
116
-
117
-
118
-
119
-
120
-
121
-
122
-
123
-
124
-
125
-
126
-
127
-
128
-
129
-
130
-
131
-
132
-
133
-
134
-
135
-
136
-
137
-
138
-
139
-
140
-
141
-
142
-
143
-
144
-
145
-
146
-
147
-
148
-
149
-
150
-
151
-
152
-
153
-
154
-
155
-
156
-
157
-
158
-
159
-
160
-
161
-
162
-
163
-
164
-
165
-
166
-
167
-
168
-
169
-
170
-
171
-
172
-
173
-
174
-
175
-
176
-
177
-
178
 |
 |

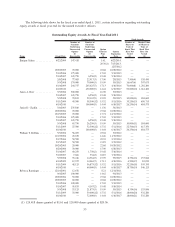
The following table shows for the fiscal year ended April 1, 2011, certain information regarding outstanding
equity awards at fiscal year end for the named executive officers.
Outstanding Equity Awards At Fiscal Year-End 2011
Name Grant Date
Number of
Securities
Underlying
Unexercised
Options
(#)
Exercisable
Number of
Securities
Underlying
Unexercised
Options
(#)
Unexercisable
Option
Exercise
Price
($)
Option
Expiration
Date
Number of
Shares or
Units of
Stock That
Have Not
Vested
(#)
Market Value
of Shares or
Units of
Stock That
Have Not
Vested
($)
Option Awards Stock Awards
Enrique Salem . . . . . . . . . . . . 6/22/2004 147,418 — 1.61, 6/22/2014, — —
20.36(1) 7/15/2013,
12/5/2012
10/20/2005 70,000 — 22.68 10/20/2012 — —
5/12/2006 175,000 — 17.02 5/12/2013 — —
5/10/2007 143,750 6,250(2) 19.48 5/10/2014 — —
2/8/2008 77,083 22,917(3) 17.90 2/8/2015 7,500(4) 138,450
5/9/2008 170,000 70,000(5) 19.99 5/9/2015 16,667(6) 307,673
4/10/2009 244,375 265,625(7) 17.13 4/10/2016 70,000(8) 1,292,200
6/10/2010 — 430,000(9) 14.44 6/10/2017 90,000(10) 1,661,400
James A. Beer . . . . . . . . . . . . 3/3/2006 300,000 — 16.98 3/3/2013 — —
5/10/2007 143,750 6,250(2) 19.48 5/10/2014 — —
5/9/2008 70,833 29,167(5) 19.99 5/9/2015 10,000(11) 184,600
5/11/2009 49,500 58,500(12) 15.32 5/11/2016 35,250(13) 650,715
6/10/2010 — 100,000(9) 14.44 6/10/2017 26,250(14) 484,575
Janice D. Chaffin . . . . . . . . . . 5/6/2003 235,840 — 11.36 5/6/2013 — —
10/20/2004 70,000 — 27.68 10/20/2014 — —
12/15/2005 70,000 — 17.74 12/15/2012 — —
5/12/2006 125,000 — 17.02 5/12/2013 — —
5/10/2007 143,750 6,250(2) 19.48 5/10/2014 — —
5/9/2008 63,750 26,250(5) 19.99 5/9/2015 10,000(11) 184,600
5/11/2009 27,500 32,500(12) 15.32 5/11/2016 22,500(15) 415,350
6/10/2010 — 100,000(9) 14.44 6/10/2017 26,250(14) 484,575
William T. Robbins . . . . . . . . . 5/3/2002 56,209 — 23.04 5/3/2012 — —
11/19/2002 45,670 — 14.46 11/19/2012 — —
2/17/2004 50,589 — 29.39 2/17/2014 — —
2/15/2005 50,589 — 21.85 2/15/2012 — —
10/20/2005 20,000 — 22.68 10/20/2012 — —
6/20/2006 30,000 — 15.90 6/20/2013 — —
5/10/2007 40,250 1,750(2) 19.48 5/10/2014 — —
7/10/2007 7,666 334(2) 18.87 7/10/2014 — —
5/9/2008 35,416 14,584(5) 19.99 5/9/2015 8,334(16) 153,846
4/10/2009 12,937 14,063(7) 17.13 4/10/2016 4,500(17) 83,070
5/11/2009 48,125 56,875(12) 15.32 5/11/2016 32,250(18) 595,335
6/10/2010 — 60,000(9) 14.44 6/10/2017 18,750(19) 346,125
Rebecca Ranninger . . . . . . . . . 12/14/2001 12,676 — 8.21 12/14/2011 — —
9/4/2003 100,000 — 14.62 9/4/2013 — —
10/20/2004 50,000 — 27.68 10/20/2014 — —
10/20/2005 60,000 — 22.68 10/20/2012 — —
5/12/2006 100,000 — 17.02 5/12/2013 — —
5/10/2007 95,833 4,167(2) 19.48 5/10/2014 — —
5/9/2008 53,125 21,875(5) 19.99 5/9/2015 8,334(16) 153,846
5/11/2009 33,000 39,000(12) 15.32 5/11/2016 18,000(20) 332,280
6/10/2010 — 72,000(9) 14.44 6/10/2017 18,000(21) 332,280
(1) 124,418 shares granted at $1.61 and 120,000 shares granted at $20.36.
53