Symantec 2011 Annual Report Download - page 162
Download and view the complete annual report
Please find page 162 of the 2011 Symantec annual report below. You can navigate through the pages in the report by either clicking on the pages listed below, or by using the keyword search tool below to find specific information within the annual report.-
 1
1 -
2
-
3
-
4
-
5
-
6
-
7
-
8
-
9
-
10
-
11
-
12
-
13
-
14
-
15
-
16
-
17
-
18
-
19
-
20
-
21
-
22
-
23
-
24
-
25
-
26
-
27
-
28
-
29
-
30
-
31
-
32
-
33
-
34
-
35
-
36
-
37
-
38
-
39
-
40
-
41
-
42
-
43
-
44
-
45
-
46
-
47
-
48
-
49
-
50
-
51
-
52
-
53
-
54
-
55
-
56
-
57
-
58
-
59
-
60
-
61
-
62
-
63
-
64
-
65
-
66
-
67
-
68
-
69
-
70
-
71
-
72
-
73
-
74
-
75
-
76
-
77
-
78
-
79
-
80
-
81
-
82
-
83
-
84
-
85
-
86
-
87
-
88
-
89
-
90
-
91
-
92
-
93
-
94
-
95
-
96
-
97
-
98
-
99
-
100
-
101
-
102
-
103
-
104
-
105
-
106
-
107
-
108
-
109
-
110
-
111
-
112
-
113
-
114
-
115
-
116
-
117
-
118
-
119
-
120
-
121
-
122
-
123
-
124
-
125
-
126
-
127
-
128
-
129
-
130
-
131
-
132
-
133
-
134
-
135
-
136
-
137
-
138
-
139
-
140
-
141
-
142
-
143
-
144
-
145
-
146
-
147
-
148
-
149
-
150
-
151
-
 152
152 -
 153
153 -
 154
154 -
 155
155 -
 156
156 -
 157
157 -
 158
158 -
 159
159 -
 160
160 -
 161
161 -
 162
162 -
 163
163 -
 164
164 -
 165
165 -
 166
166 -
 167
167 -
 168
168 -
 169
169 -
 170
170 -
 171
171 -
 172
172 -
173
-
174
-
175
-
176
-
177
-
178
 |
 |

protection solutions across heterogeneous storage and server platforms, as well as solutions delivered
through our SaaS offerings.
•Services. Our Services segment provides customers with implementation services and solutions designed
to assist them in maximizing the value of their Symantec software. Our offerings include consulting,
business critical services, education, and managed security services.
•Other. Our Other segment is comprised of sunset products and products nearing the end of their life cycle.
It also includes general and administrative expenses; amortization of acquired product rights, intangible
assets, and other assets; goodwill impairment charges; charges such as stock-based compensation and
restructuring; and certain indirect costs that are not charged to the other operating segments.
The accounting policies of the segments are the same as those described in Note 1. There are no intersegment
sales. Our chief operating decision maker evaluates performance primarily based on net revenue. Except for
goodwill, as disclosed in Note 4, the majority of our assets are not discretely identified by segment. The
depreciation and amortization of our property, equipment, and leasehold improvements are allocated based on
headcount, unless specifically identified by segment.
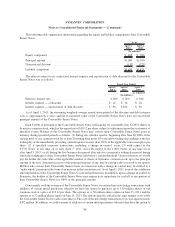
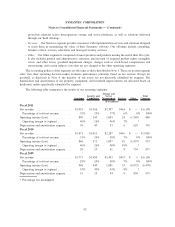
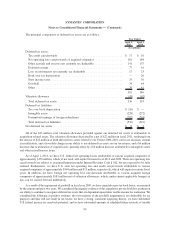
The following table summarizes the results of our operating segments:
Consumer
Security and
Compliance
Storage and
Server
Management Services Other
Total
Company
($ in millions)
Fiscal 2011
Net revenue........................ $1,953 $1,566 $2,307 $364 $ — $ 6,190
Percentage of total net revenue ........ 32% 25% 37% 6% 0% 100%
Operating income (loss) ............... 899 243 1,063 24 (1,349) 880
Operating margin of segment ......... 46% 16% 46% 7% *
Depreciation and amortization expense . . . . 39 40 33 6 625 743
Fiscal 2010
Net revenue........................ $1,871 $1,411 $2,287 $416 $ — $ 5,985
Percentage of total net revenue ........ 31% 24% 38% 7% 0% 100%
Operating income (loss) ............... 860 371 1,097 42 (1,437) 933
Operating margin of segment ......... 46% 26% 48% 10% *
Depreciation and amortization expense . . . . 29 25 41 8 734 837
Fiscal 2009
Net revenue........................ $1,773 $1,450 $2,493 $433 $ 1 $ 6,150
Percentage of total net revenue ........ 29% 24% 40% 7% 0% 100%
Operating income (loss) ............... 948 440 1,081 33 (8,972) (6,470)
Operating margin of segment ......... 53% 30% 43% 8% *
Depreciation and amortization expense . . . . 15 25 54 9 830 933
* Percentage not meaningful.
92
SYMANTEC CORPORATION
Notes to Consolidated Financial Statements — (Continued)