Symantec 2011 Annual Report Download - page 51
Download and view the complete annual report
Please find page 51 of the 2011 Symantec annual report below. You can navigate through the pages in the report by either clicking on the pages listed below, or by using the keyword search tool below to find specific information within the annual report.-
 1
1 -
2
-
3
-
4
-
5
-
6
-
7
-
8
-
9
-
10
-
11
-
12
-
13
-
14
-
15
-
16
-
17
-
18
-
19
-
20
-
21
-
22
-
23
-
24
-
25
-
26
-
27
-
28
-
29
-
30
-
31
-
32
-
33
-
34
-
35
-
36
-
37
-
38
-
39
-
40
-
 41
41 -
 42
42 -
 43
43 -
 44
44 -
 45
45 -
 46
46 -
 47
47 -
 48
48 -
 49
49 -
 50
50 -
 51
51 -
 52
52 -
 53
53 -
 54
54 -
 55
55 -
 56
56 -
 57
57 -
 58
58 -
 59
59 -
 60
60 -
 61
61 -
62
-
63
-
64
-
65
-
66
-
67
-
68
-
69
-
70
-
71
-
72
-
73
-
74
-
75
-
76
-
77
-
78
-
79
-
80
-
81
-
82
-
83
-
84
-
85
-
86
-
87
-
88
-
89
-
90
-
91
-
92
-
93
-
94
-
95
-
96
-
97
-
98
-
99
-
100
-
101
-
102
-
103
-
104
-
105
-
106
-
107
-
108
-
109
-
110
-
111
-
112
-
113
-
114
-
115
-
116
-
117
-
118
-
119
-
120
-
121
-
122
-
123
-
124
-
125
-
126
-
127
-
128
-
129
-
130
-
131
-
132
-
133
-
134
-
135
-
136
-
137
-
138
-
139
-
140
-
141
-
142
-
143
-
144
-
145
-
146
-
147
-
148
-
149
-
150
-
151
-
152
-
153
-
154
-
155
-
156
-
157
-
158
-
159
-
160
-
161
-
162
-
163
-
164
-
165
-
166
-
167
-
168
-
169
-
170
-
171
-
172
-
173
-
174
-
175
-
176
-
177
-
178
 |
 |

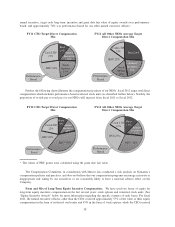
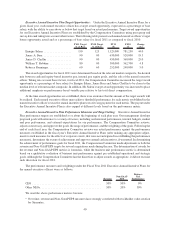
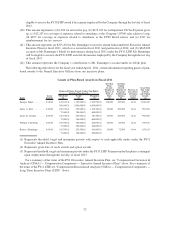
plan at 130% of the plan target amount. For purposes of calculating achievements under these goals, foreign
exchange movements were held constant at plan rates, pursuant to the terms of the plans. In general, business unit
performance was above target for each of our named executive officers whose award included a business unit
performance goal. Our NEOs’ fiscal 2011 total payout as percentage of target opportunity and total payout amounts
are provided in the table below:
Total Payout as
% of Target
Payout
Amount ($)
Enrique Salem ........................................... 105 1,181,250
James A. Beer ........................................... 104 652,050
Janice D. Chaffin ......................................... 95 425,250
William T. Robbins ....................................... 108 410,400
Rebecca Ranninger ........................................ 101 253,260
Long Term Incentive Plan (LTIP)
In May 2010, the Compensation Committee approved our LTIP for fiscal 2011. Under the terms of the FY11
LTIP, named executive officers are eligible to receive performance-based compensation based upon the level of
attainment of target operating cash flow for the fiscal year ending April 1, 2011. The Compensation Committee
implemented the FY11 LTIP to provide an ongoing retention and performance incentive by balancing option and
restricted stock unit vesting periods (four years each) with a component that will enhance the alignment to long-
term financial performance. The FY11 LTIP was adopted pursuant to the SEIP most recently approved by our
stockholders in 2008.
FY11 LTIP Target Opportunities: The target bonus amounts under the FY11 LTIP were $2,000,000 for
Enrique Salem and $300,000 for each of the other named executive officers.
FY11 LTIP Performance Measure and Target Setting: Under the FY11 LTIP, the long-term incentive
metric is measured at the end of the one-year performance period (i.e., the end of fiscal 2011) and, subject to the
meeting of the performance target(s) and satisfaction of continuing service requirements, will be paid following the
last day of the second fiscal year following the end of the performance period (i.e., the end of fiscal 2013). We
believe the combination of these performance goals and this time-based vesting period provide appropriate
performance incentives and promote the long-term retention of our executive officers. By basing the FY11 LTIP
payout on operating cash flow, the plan focuses on a specific, measurable corporate goal that is aligned with
generating stockholder value, and provides performance-based compensation based upon the actual achievement of
the goal. We believe that the exclusive metric of operating cash flow, as opposed to revenue or EPS, appropriately
focuses our executives on tangible growth and cost reduction opportunities. Operating cash flow is also a direct
measure of business success and balances the annual plan measures that are not subject to some of the timing issues
associated with the accounting rules relating to revenue and EPS, which can lead to fluctuations in results that are
not necessarily directly tied to our business success.
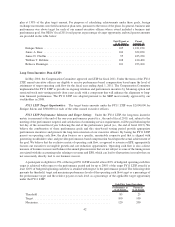
A participant is eligible for 25% of the target FY11 LTIP award if at least 85% of budgeted operating cash flow
target is achieved with respect to the performance period and for up to 200% of the target FY11 LTIP award if at
least 120% of budgeted operating cash flow is attained with respect to the performance period. The following table
presents the threshold, target and maximum performance levels of the operating cash flow target as a percentage of
the performance target and the relative payout at each level as a percentage of the applicable target opportunity
under the FY11 LTIP:
Performance as
% of Target
Payout as
% of Target
Cash Flow from Operations
Threshold .............................................. 85 25
Target................................................. 100 100
Maximum .............................................. 120 200
42