Symantec 2011 Annual Report Download - page 106
Download and view the complete annual report
Please find page 106 of the 2011 Symantec annual report below. You can navigate through the pages in the report by either clicking on the pages listed below, or by using the keyword search tool below to find specific information within the annual report.-
 1
1 -
2
-
3
-
4
-
5
-
6
-
7
-
8
-
9
-
10
-
11
-
12
-
13
-
14
-
15
-
16
-
17
-
18
-
19
-
20
-
21
-
22
-
23
-
24
-
25
-
26
-
27
-
28
-
29
-
30
-
31
-
32
-
33
-
34
-
35
-
36
-
37
-
38
-
39
-
40
-
41
-
42
-
43
-
44
-
45
-
46
-
47
-
48
-
49
-
50
-
51
-
52
-
53
-
54
-
55
-
56
-
57
-
58
-
59
-
60
-
61
-
62
-
63
-
64
-
65
-
66
-
67
-
68
-
69
-
70
-
71
-
72
-
73
-
74
-
75
-
76
-
77
-
78
-
79
-
80
-
81
-
82
-
83
-
84
-
85
-
86
-
87
-
88
-
89
-
90
-
91
-
92
-
93
-
94
-
95
-
 96
96 -
 97
97 -
 98
98 -
 99
99 -
 100
100 -
 101
101 -
 102
102 -
 103
103 -
 104
104 -
 105
105 -
 106
106 -
 107
107 -
 108
108 -
 109
109 -
 110
110 -
 111
111 -
 112
112 -
 113
113 -
 114
114 -
 115
115 -
 116
116 -
117
-
118
-
119
-
120
-
121
-
122
-
123
-
124
-
125
-
126
-
127
-
128
-
129
-
130
-
131
-
132
-
133
-
134
-
135
-
136
-
137
-
138
-
139
-
140
-
141
-
142
-
143
-
144
-
145
-
146
-
147
-
148
-
149
-
150
-
151
-
152
-
153
-
154
-
155
-
156
-
157
-
158
-
159
-
160
-
161
-
162
-
163
-
164
-
165
-
166
-
167
-
168
-
169
-
170
-
171
-
172
-
173
-
174
-
175
-
176
-
177
-
178
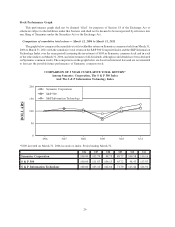
 |
 |

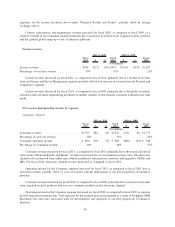
segments for the reasons discussed above under “Financial Results and Trends”, partially offset by foreign
exchange effects.
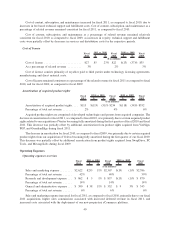
Content, subscription, and maintenance revenue increased for fiscal 2010, as compared to fiscal 2009, as a
result of strength in our Consumer segment primarily due to increases in revenue from acquired security products
and the gradual global ramp up of our eCommerce platform.
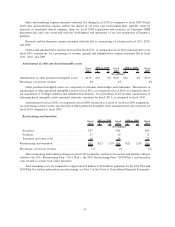
License revenue
Fiscal
2011 $ %
Fiscal
2010 $ %
Fiscal
2009
2011 vs. 2010 2010 vs. 2009
($ in millions)
License revenue .......................... $924 $(27) (3)% $951 $(336) (26)% $1,287
Percentage of total net revenue ............... 15% 16% 21%
License revenue decreased for fiscal 2011, as compared to fiscal 2010, primarily due to a decline in revenue
from our Storage and Server Management segment, partially offset by an increase in revenue from our Security and
Compliance segment.
License revenue decreased for fiscal 2010, as compared to fiscal 2009, primarily due to the global economic
slowdown and customers emphasizing purchases of smaller volumes of new licenses consistent with their near term
needs.
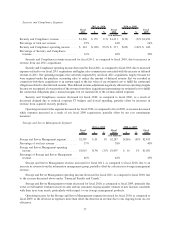
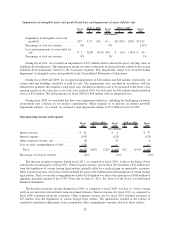
Net revenue and operating income by segment
Consumer Segment
Fiscal
2011 $ %
Fiscal
2010 $ %
Fiscal
2009
2011 vs. 2010 2010 vs. 2009
($ in millions)
Consumer revenue . . . . . . . . . . . . . . . . . . . . . . . . $1,953 $82 4% $1,871 $ 98 6% $1,773
Percentage of total net revenue . . . . . . . . . . . . . . . 32% 31% 29%
Consumer operating income . . . . . . . . . . . . . . . . . $ 899 $39 5% $ 860 $(88) (9)% $ 948
Percentage of Consumer revenue . . . . . . . . . . . . . 46% 46% 53%
Consumer revenue increased for fiscal 2011, as compared to fiscal 2010, primarily due to the reasons discussed
above under “Financial Results and Trends” as well as increased sales of our premium security suite. Our electronic
channel sales are derived from online sales (which include new subscriptions, renewals, and upgrades), OEMs, and
ISPs. For fiscal 2011, electronic channel revenue increased as compared to fiscal 2010.
Operating income for the Consumer segment increased for fiscal 2011, as compared to fiscal 2010, due to
increased revenue, partially offset by costs associated with the deployment of our new proprietary eCommerce
platform.
Consumer revenue increased for fiscal 2010, as compared to fiscal 2009, primarily due to increases in revenue
from acquired security products and our core consumer products in the electronic channel.
Operating income for the Consumer segment decreased for fiscal 2010, as compared to fiscal 2009, as expense
growth outpaced revenue growth. Total expenses for the segment increased primarily as a result of the higher OEM
placement fees and costs associated with our development and operation of our new proprietary eCommerce
platform.
36