PNC Bank 2005 Annual Report Download - page 99
Download and view the complete annual report
Please find page 99 of the 2005 PNC Bank annual report below. You can navigate through the pages in the report by either clicking on the pages listed below, or by using the keyword search tool below to find specific information within the annual report.-
 1
1 -
2
-
3
-
4
-
5
-
6
-
7
-
8
-
9
-
10
-
11
-
12
-
13
-
14
-
15
-
16
-
17
-
18
-
19
-
20
-
21
-
22
-
23
-
24
-
25
-
26
-
27
-
28
-
29
-
30
-
31
-
32
-
33
-
34
-
35
-
36
-
37
-
38
-
39
-
40
-
41
-
42
-
43
-
44
-
45
-
46
-
47
-
48
-
49
-
50
-
51
-
52
-
53
-
54
-
55
-
56
-
57
-
58
-
59
-
60
-
61
-
62
-
63
-
64
-
65
-
66
-
67
-
68
-
69
-
70
-
71
-
72
-
73
-
74
-
75
-
76
-
77
-
78
-
79
-
80
-
81
-
82
-
83
-
84
-
85
-
86
-
87
-
88
-
 89
89 -
 90
90 -
 91
91 -
 92
92 -
 93
93 -
 94
94 -
 95
95 -
 96
96 -
 97
97 -
 98
98 -
 99
99 -
 100
100 -
 101
101 -
 102
102 -
 103
103 -
 104
104 -
 105
105 -
 106
106 -
 107
107 -
 108
108 -
 109
109 -
110
-
111
-
112
-
113
-
114
-
115
-
116
-
117
-
118
-
119
-
120
-
121
-
122
-
123
-
124
-
125
-
126
-
127
-
128
-
129
-
130
-
131
-
132
-
133
-
134
-
135
-
136
-
137
-
138
-
139
-
140
-
141
-
142
-
143
-
144
-
145
-
146
-
147
-
148
-
149
-
150
-
151
-
152
-
153
-
154
-
155
-
156
-
157
-
158
-
159
-
160
-
161
-
162
-
163
-
164
-
165
-
166
-
167
-
168
-
169
-
170
-
171
-
172
-
173
-
174
-
175
-
176
-
177
-
178
-
179
-
180
-
181
-
182
-
183
-
184
-
185
-
186
-
187
-
188
-
189
-
190
-
191
-
192
-
193
-
194
-
195
-
196
-
197
-
198
-
199
-
200
-
201
-
202
-
203
-
204
-
205
-
206
-
207
-
208
-
209
-
210
-
211
-
212
-
213
-
214
-
215
-
216
-
217
-
218
-
219
-
220
-
221
-
222
-
223
-
224
-
225
-
226
-
227
-
228
-
229
-
230
-
231
-
232
-
233
-
234
-
235
-
236
-
237
-
238
-
239
-
240
-
241
-
242
-
243
-
244
-
245
-
246
-
247
-
248
-
249
-
250
-
251
-
252
-
253
-
254
-
255
-
256
-
257
-
258
-
259
-
260
-
261
-
262
-
263
-
264
-
265
-
266
-
267
-
268
-
269
-
270
-
271
-
272
-
273
-
274
-
275
-
276
-
277
-
278
-
279
-
280
-
281
-
282
-
283
-
284
-
285
-
286
-
287
-
288
-
289
-
290
-
291
-
292
-
293
-
294
-
295
-
296
-
297
-
298
-
299
-
300
 |
 |

99
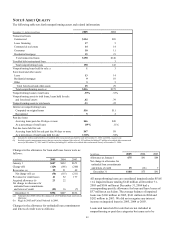
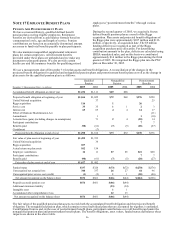
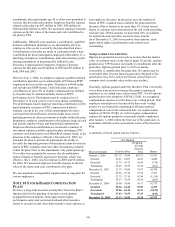
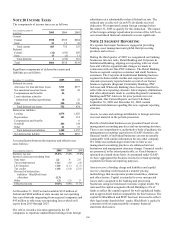
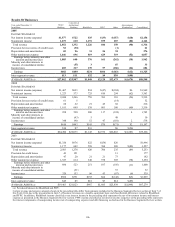
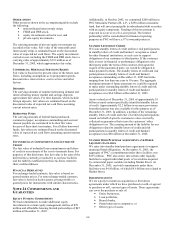
The components of net periodic pension and postretirement benefit cost/(income) were as follows:
Qualified Pension Plan
Nonqualified Pension Plan
Postretirement Benefits
Year ended December 31 – in millions 2005 2004 2003 2005 2004 2003 2005 2004 2003
Service cost $33 $35 $36 $1 $1 $1 $2 $3 $2
Interest cost 65 65 62 4 4 4 14 17 16
Expected return on plan assets (128) (112) (90)
Amortization of prior service cost (1) (1) (1) (7) (6) (6)
Recognized net actuarial loss 23 23 43 3 3 2 4 5 4
Curtailment (gain) (1)
Losses due to settlements 4
Net periodic cost $(8) $9 $50 $8 $8 $11 $13 $19 $16
The weighted-average assumptions used (as of the
beginning of each year) to determine net periodic costs
shown above were as follows:
Net Periodic Cost Determination
Year ended December 31
2005
2004
2003
Discount rate 5.25% 6.00% 6.75%
Rate of compensation
increase 4.00 4.00 4.00
Assumed health care cost
trend rate
Initial trend 10.00 11.00 11.00
Ultimate trend 5.00 5.00 5.25
Year ultimate reached 2010 2010 2009
Expected long-term
return on plan assets 8.50 8.50 8.50
The weighted-average assumptions used (as of the end of
each year) to determine year-end obligations for both
pension and postretirement benefits were as follows:
At December 31
2005
2004
Discount rate
Qualified pension 5.50% 5.25%
Nonqualified pension 5.40 5.25
Postretirement benefits 5.60 5.25
Rate of compensation increase 4.00 4.00
Assumed health care cost trend rate
Initial trend 10.00 10.00
Ultimate trend 5.00 5.00
Year to reach ultimate
2011
2010
As of December 31, 2005, the discount rate assumption was
determined independently for each plan reflecting the duration
of each plan’ s obligations. Specifically, a yield curve was
produced for a universe containing the majority of US-issued
Aa grade corporate bonds, all of which were non-callable (or
callable with make-whole provisions). Excluded from this
yield curve were the 10% of the bonds with the highest yields
and the 10% with the lowest yields. For each plan, the discount
rate was determined as the level equivalent rate that would
produce the same present value obligation as that using spot
rates aligned with the projected benefit payments.
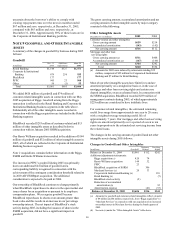
The health care cost trend rate assumptions shown in the
preceding tables relate only to the postretirement benefit plans.
A one-percentage-point change in assumed health care cost
trend rates would have the following effects:
Year ended December 31, 2005
–
in millions
Increase
Decrease
Effect on total service and interest cost $1
$(1)
Effect on year-end benefit obligation 13
(12)
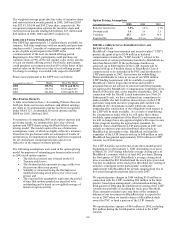
MEDICARE REFORM
In December 2003, the Medicare Prescription Drug,
Improvement and Modernization Act of 2003 (the “Act”) was
enacted. The Act established a prescription drug benefit under
Medicare, known as “Medicare Part D,” and a federal subsidy
to sponsors of postretirement plans that provide a benefit that is
at least actuarially equivalent to Medicare Part D. Our
actuaries have attested that the benefits we provide to certain
participants are at least actuarially equivalent to Medicare Part
D, and, accordingly, we will be entitled to a subsidy.
In accordance with FSP 106-2, the effects of the Act were
considered an actuarial gain on December 31, 2004, and
recognized in the same manner as other actuarial gains and
losses. The Act reduced 2005 net periodic cost by $1 million.
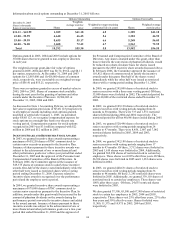
DEFINED CONTRIBUTION PLANS
We have a contributory, qualified defined contribution plan that
covers substantially all employees except those covered by
other plans as identified below. Under this plan, employee
contributions up to 6% of eligible compensation as defined by
the plan are matched 100%, subject to Code limitations. The
plan is a 401(k) plan and includes an employee stock ownership
(“ESOP”) feature. Employee contributions are invested in a
number of investment options available under the plan,
including a PNC common stock fund and several BlackRock
mutual funds, at the direction of the employee. All shares of
PNC common stock held by the plan are part of the ESOP.
Employee contributions to the plan for 2005, 2004 and 2003
were matched primarily by shares of PNC common stock held
in treasury, except in the case of those participants who have
exercised their diversification election rights to have their
matching portion in other investments available within the plan.
Effective November 22, 2005, we amended the plan to provide
all participants the ability to diversify the matching portion of
their plan account invested in shares of PNC common stock
into other investments available within the plan. Prior to this