PNC Bank 2005 Annual Report Download - page 87
Download and view the complete annual report
Please find page 87 of the 2005 PNC Bank annual report below. You can navigate through the pages in the report by either clicking on the pages listed below, or by using the keyword search tool below to find specific information within the annual report.-
 1
1 -
2
-
3
-
4
-
5
-
6
-
7
-
8
-
9
-
10
-
11
-
12
-
13
-
14
-
15
-
16
-
17
-
18
-
19
-
20
-
21
-
22
-
23
-
24
-
25
-
26
-
27
-
28
-
29
-
30
-
31
-
32
-
33
-
34
-
35
-
36
-
37
-
38
-
39
-
40
-
41
-
42
-
43
-
44
-
45
-
46
-
47
-
48
-
49
-
50
-
51
-
52
-
53
-
54
-
55
-
56
-
57
-
58
-
59
-
60
-
61
-
62
-
63
-
64
-
65
-
66
-
67
-
68
-
69
-
70
-
71
-
72
-
73
-
74
-
75
-
76
-
 77
77 -
 78
78 -
 79
79 -
 80
80 -
 81
81 -
 82
82 -
 83
83 -
 84
84 -
 85
85 -
 86
86 -
 87
87 -
 88
88 -
 89
89 -
 90
90 -
 91
91 -
 92
92 -
 93
93 -
 94
94 -
 95
95 -
 96
96 -
 97
97 -
98
-
99
-
100
-
101
-
102
-
103
-
104
-
105
-
106
-
107
-
108
-
109
-
110
-
111
-
112
-
113
-
114
-
115
-
116
-
117
-
118
-
119
-
120
-
121
-
122
-
123
-
124
-
125
-
126
-
127
-
128
-
129
-
130
-
131
-
132
-
133
-
134
-
135
-
136
-
137
-
138
-
139
-
140
-
141
-
142
-
143
-
144
-
145
-
146
-
147
-
148
-
149
-
150
-
151
-
152
-
153
-
154
-
155
-
156
-
157
-
158
-
159
-
160
-
161
-
162
-
163
-
164
-
165
-
166
-
167
-
168
-
169
-
170
-
171
-
172
-
173
-
174
-
175
-
176
-
177
-
178
-
179
-
180
-
181
-
182
-
183
-
184
-
185
-
186
-
187
-
188
-
189
-
190
-
191
-
192
-
193
-
194
-
195
-
196
-
197
-
198
-
199
-
200
-
201
-
202
-
203
-
204
-
205
-
206
-
207
-
208
-
209
-
210
-
211
-
212
-
213
-
214
-
215
-
216
-
217
-
218
-
219
-
220
-
221
-
222
-
223
-
224
-
225
-
226
-
227
-
228
-
229
-
230
-
231
-
232
-
233
-
234
-
235
-
236
-
237
-
238
-
239
-
240
-
241
-
242
-
243
-
244
-
245
-
246
-
247
-
248
-
249
-
250
-
251
-
252
-
253
-
254
-
255
-
256
-
257
-
258
-
259
-
260
-
261
-
262
-
263
-
264
-
265
-
266
-
267
-
268
-
269
-
270
-
271
-
272
-
273
-
274
-
275
-
276
-
277
-
278
-
279
-
280
-
281
-
282
-
283
-
284
-
285
-
286
-
287
-
288
-
289
-
290
-
291
-
292
-
293
-
294
-
295
-
296
-
297
-
298
-
299
-
300
 |
 |

87
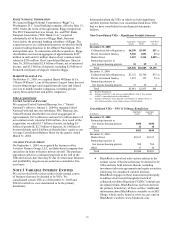
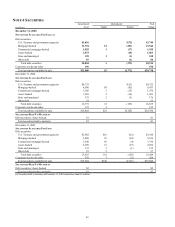
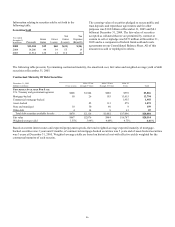
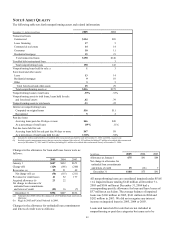
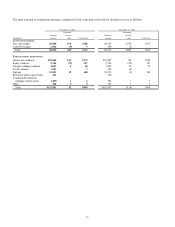
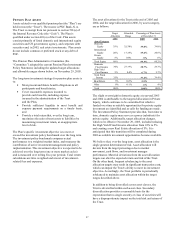
NOTE 7 LOANS, COMMITMENTS TO EXTEND CREDIT AND CONCENTRATIONS OF CREDIT RISK
Loans outstanding were as follows:
December 31
-
in mi
llions
2005
2004
Commercial $19,325 $17,438
Commercial real estate 3,162 1,980
Consumer 16,173 15,606
Residential mortgage 7,307 4,772
Lease financing 3,628 4,096
Other 341 505
Total loans
49,936
44,397
Unearned income (835) (902)
Total loans, net of unearned income $49,101 $43,495
Total loans, net of unearned income, at December 31, 2004 included $2.3 billion related to Market Street. See Note 3 Variable
Interest Entities regarding the deconsolidation of Market Street effective October 17, 2005.
We realized net gains from sales of commercial mortgages of $61 million in 2005, $50 million in 2004, and $52 million in 2003.
Net gains in excess of valuation adjustments related to the liquidation of our institutional loans held for sale totaled $7 million in
2005, $52 million in 2004, and $69 million in 2003. The liquidation of our institutional loans held for sale is complete. Gains on
sales of education loans totaled $19 million in 2005, $30 million in 2004, and $20 million in 2003.
Concentrations of credit risk exist when changes in economic, industry or geographic factors similarly affect groups of
counterparties whose aggregate exposure is material in relation to our total credit exposure. Loans outstanding and related
unfunded commitments are concentrated in our primary geographic markets. At December 31, 2005, no specific industry
concentration exceeded 4.2% of total commercial loans outstanding and unfunded commitments.
In the normal course of business, we originate or purchase loan products whose contractual features, when concentrated, may
increase our exposure as a holder and servicer of those loan products. Possible product terms and features that may create a
concentration of credit risk would include loan products whose terms permit negative amortization, a high loan-to-value ratio,
features that may expose the borrower to future increases in repayments above increases in market interest rates, below-market
interest rates and interest-only loans, among others.
We originate interest-only loans to commercial borrowers. These products are standard in the financial services industry and the
features of these products are considered during the underwriting process to mitigate the increased risk of this product feature that
may result in borrowers not being able to make interest and principal payments when due. We do not believe that these product
features create a concentration of credit risk.
We also originate home equity loans and lines of credit that result in a credit concentration of high loan-to-value ratio loan
products at the time of origination. In addition, these loans are concentrated in our primary geographic markets as discussed
above. At December 31, 2005, $5.6 billion of the $15.2 billion of home equity and other consumer loans (included in
“Consumer” in the table above) had a loan-to-value ratio greater than 80%. These loans are collateralized primarily by 1-4 family
residential properties. As part of our asset and liability management activities, we also periodically purchase residential mortgage
loans that are collateralized by 1-4 family residential properties. At December 31, 2005, $3.8 billion of the $7.3 billion of
residential mortgage loans were interest-only loans.
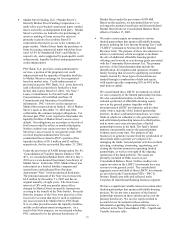
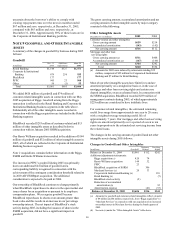
Net Unfunded Credit Commitments
December 31
-
in millions
2005
2004
Commercial $27,774 $20,969
Consumer 9,471 7,655
Commercial real estate 2,337 1,199
Other 596 483
Total $40,178 $30,306
Commitments to extend credit represent arrangements to lend
funds subject to specified contractual conditions. At both
December 31, 2005 and December 31, 2004, commercial
commitments are reported net of $6.7 billion of
participations, assignments and syndications, primarily to
financial services companies. Commitments generally have
fixed expiration dates, may require payment of a fee, and
contain termination clauses in the event the customer’ s credit
quality deteriorates. Based on our historical experience, most
commitments expire unfunded, and therefore cash
requirements are substantially less than the total
commitment.
As a result of deconsolidating Market Street in October 2005,
amounts related to Market Street were considered third party
unfunded commitments at December 31, 2005. These unfunded
credit commitments totaled $4.6 billion at December 31, 2005
and are included in the preceding table primarily within the
“Commercial” and “Consumer” categories.