PNC Bank 2005 Annual Report Download - page 30
Download and view the complete annual report
Please find page 30 of the 2005 PNC Bank annual report below. You can navigate through the pages in the report by either clicking on the pages listed below, or by using the keyword search tool below to find specific information within the annual report.-
 1
1 -
2
-
3
-
4
-
5
-
6
-
7
-
8
-
9
-
10
-
11
-
12
-
13
-
14
-
15
-
16
-
17
-
18
-
19
-
 20
20 -
 21
21 -
 22
22 -
 23
23 -
 24
24 -
 25
25 -
 26
26 -
 27
27 -
 28
28 -
 29
29 -
 30
30 -
 31
31 -
 32
32 -
 33
33 -
 34
34 -
 35
35 -
 36
36 -
 37
37 -
 38
38 -
 39
39 -
 40
40 -
41
-
42
-
43
-
44
-
45
-
46
-
47
-
48
-
49
-
50
-
51
-
52
-
53
-
54
-
55
-
56
-
57
-
58
-
59
-
60
-
61
-
62
-
63
-
64
-
65
-
66
-
67
-
68
-
69
-
70
-
71
-
72
-
73
-
74
-
75
-
76
-
77
-
78
-
79
-
80
-
81
-
82
-
83
-
84
-
85
-
86
-
87
-
88
-
89
-
90
-
91
-
92
-
93
-
94
-
95
-
96
-
97
-
98
-
99
-
100
-
101
-
102
-
103
-
104
-
105
-
106
-
107
-
108
-
109
-
110
-
111
-
112
-
113
-
114
-
115
-
116
-
117
-
118
-
119
-
120
-
121
-
122
-
123
-
124
-
125
-
126
-
127
-
128
-
129
-
130
-
131
-
132
-
133
-
134
-
135
-
136
-
137
-
138
-
139
-
140
-
141
-
142
-
143
-
144
-
145
-
146
-
147
-
148
-
149
-
150
-
151
-
152
-
153
-
154
-
155
-
156
-
157
-
158
-
159
-
160
-
161
-
162
-
163
-
164
-
165
-
166
-
167
-
168
-
169
-
170
-
171
-
172
-
173
-
174
-
175
-
176
-
177
-
178
-
179
-
180
-
181
-
182
-
183
-
184
-
185
-
186
-
187
-
188
-
189
-
190
-
191
-
192
-
193
-
194
-
195
-
196
-
197
-
198
-
199
-
200
-
201
-
202
-
203
-
204
-
205
-
206
-
207
-
208
-
209
-
210
-
211
-
212
-
213
-
214
-
215
-
216
-
217
-
218
-
219
-
220
-
221
-
222
-
223
-
224
-
225
-
226
-
227
-
228
-
229
-
230
-
231
-
232
-
233
-
234
-
235
-
236
-
237
-
238
-
239
-
240
-
241
-
242
-
243
-
244
-
245
-
246
-
247
-
248
-
249
-
250
-
251
-
252
-
253
-
254
-
255
-
256
-
257
-
258
-
259
-
260
-
261
-
262
-
263
-
264
-
265
-
266
-
267
-
268
-
269
-
270
-
271
-
272
-
273
-
274
-
275
-
276
-
277
-
278
-
279
-
280
-
281
-
282
-
283
-
284
-
285
-
286
-
287
-
288
-
289
-
290
-
291
-
292
-
293
-
294
-
295
-
296
-
297
-
298
-
299
-
300
 |
 |

30
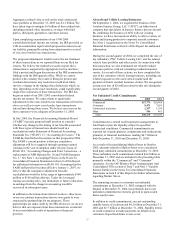
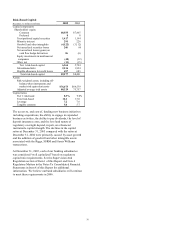
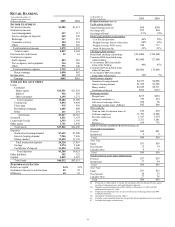
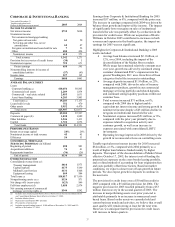
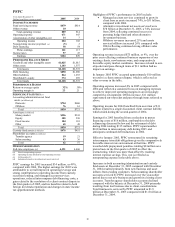
Risk-Based Capital
December 31 - dollars in millions 2005 2004
Capital components
Shareholders’ equity
Common $8,555 $7,465
Preferred 8 8
Trust preferred capital securities 1,417 1,194
Minority interest 291 226
Goodwill and other intangibles (4,122) (3,112)
Net unrealized securities losses 240 66
Net unrealized losses (gains) on
cash flow hedge derivatives 26 (6)
Equity investments in nonfinancial
companies (40)
(32)
Other, net (11)
(15)
Tier 1 risk-based capital 6,364 5,794
Subordinated debt 2,216 1,924
Eligible allowance for credit losses 697 683
Total risk-based capital $9,277 $8,401
Assets
Risk-weighted assets, including off-
balance-sheet instruments and
market risk equivalent assets $76,673 $64,539
Adjusted average total assets 88,329 75,757
Capital ratios
Tier 1 risk-based 8.3% 9.0%
Total risk-based 12.1 13.0
Leverage 7.2 7.6
Tangible common 5.0 5.7
The access to, and cost of, funding new business initiatives
including acquisitions, the ability to engage in expanded
business activities, the ability to pay dividends, the level of
deposit insurance costs, and the level and nature of
regulatory oversight depend, in part, on a financial
institution's capital strength. The declines in the capital
ratios at December 31, 2005 compared with the ratios at
December 31, 2004 were primarily caused by asset growth
and the addition of goodwill and other intangible assets
associated with the Riggs, SSRM and Harris Williams
transactions.
At December 31, 2005, each of our banking subsidiaries
was considered “well capitalized” based on regulatory
capital ratio requirements. See the Supervision And
Regulation section of Item 1 of this Report and Note 4
Regulatory Matters in the Notes To Consolidated Financial
Statements in Item 8 of this Report for additional
information. We believe our bank subsidiaries will continue
to meet these requirements in 2006.