PNC Bank 2005 Annual Report Download - page 35
Download and view the complete annual report
Please find page 35 of the 2005 PNC Bank annual report below. You can navigate through the pages in the report by either clicking on the pages listed below, or by using the keyword search tool below to find specific information within the annual report.-
 1
1 -
2
-
3
-
4
-
5
-
6
-
7
-
8
-
9
-
10
-
11
-
12
-
13
-
14
-
15
-
16
-
17
-
18
-
19
-
20
-
21
-
22
-
23
-
24
-
 25
25 -
 26
26 -
 27
27 -
 28
28 -
 29
29 -
 30
30 -
 31
31 -
 32
32 -
 33
33 -
 34
34 -
 35
35 -
 36
36 -
 37
37 -
 38
38 -
 39
39 -
 40
40 -
 41
41 -
 42
42 -
 43
43 -
 44
44 -
 45
45 -
46
-
47
-
48
-
49
-
50
-
51
-
52
-
53
-
54
-
55
-
56
-
57
-
58
-
59
-
60
-
61
-
62
-
63
-
64
-
65
-
66
-
67
-
68
-
69
-
70
-
71
-
72
-
73
-
74
-
75
-
76
-
77
-
78
-
79
-
80
-
81
-
82
-
83
-
84
-
85
-
86
-
87
-
88
-
89
-
90
-
91
-
92
-
93
-
94
-
95
-
96
-
97
-
98
-
99
-
100
-
101
-
102
-
103
-
104
-
105
-
106
-
107
-
108
-
109
-
110
-
111
-
112
-
113
-
114
-
115
-
116
-
117
-
118
-
119
-
120
-
121
-
122
-
123
-
124
-
125
-
126
-
127
-
128
-
129
-
130
-
131
-
132
-
133
-
134
-
135
-
136
-
137
-
138
-
139
-
140
-
141
-
142
-
143
-
144
-
145
-
146
-
147
-
148
-
149
-
150
-
151
-
152
-
153
-
154
-
155
-
156
-
157
-
158
-
159
-
160
-
161
-
162
-
163
-
164
-
165
-
166
-
167
-
168
-
169
-
170
-
171
-
172
-
173
-
174
-
175
-
176
-
177
-
178
-
179
-
180
-
181
-
182
-
183
-
184
-
185
-
186
-
187
-
188
-
189
-
190
-
191
-
192
-
193
-
194
-
195
-
196
-
197
-
198
-
199
-
200
-
201
-
202
-
203
-
204
-
205
-
206
-
207
-
208
-
209
-
210
-
211
-
212
-
213
-
214
-
215
-
216
-
217
-
218
-
219
-
220
-
221
-
222
-
223
-
224
-
225
-
226
-
227
-
228
-
229
-
230
-
231
-
232
-
233
-
234
-
235
-
236
-
237
-
238
-
239
-
240
-
241
-
242
-
243
-
244
-
245
-
246
-
247
-
248
-
249
-
250
-
251
-
252
-
253
-
254
-
255
-
256
-
257
-
258
-
259
-
260
-
261
-
262
-
263
-
264
-
265
-
266
-
267
-
268
-
269
-
270
-
271
-
272
-
273
-
274
-
275
-
276
-
277
-
278
-
279
-
280
-
281
-
282
-
283
-
284
-
285
-
286
-
287
-
288
-
289
-
290
-
291
-
292
-
293
-
294
-
295
-
296
-
297
-
298
-
299
-
300
 |
 |
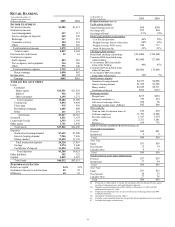
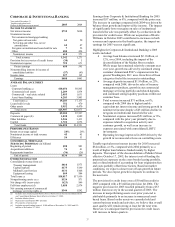
35
Retail Banking’ s earnings increased $72 million, or 12%, for
2005 compared with 2004. Continued organic customer
growth and the expansion into the greater Washington, D.C.
area drove a growing balance sheet and a corresponding
revenue increase of 6%. A sustained focus on expense
management and improving credit quality also contributed to
the 12% earnings growth.
Highlights of Retail Banking’ s performance during 2005
include:
• Consumer and small business checking relationships
increased by 172,000, or 10%, compared with December
31, 2004.
• Consumer-related new checking relationships increased
10%, average consumer demand deposits increased 7%
and home equity loans increased 15% compared with the
comparable prior year amounts.
• The small business area continued its positive momentum
with strong customer and balance sheet growth. Average
small business loans increased 19% over 2004 on the
strength of increased demand from both existing
customers and new relationships. Small business deposits
increased 6% over the same period and new checking
relationships increased 8%.
• The wealth management business sustained solid growth
over 2004 as asset management fees increased $20
million as a result of pricing enhancements, certain one-
time fees and the expansion into the greater Washington,
D.C. area. Assets under management totaled $49 billion
at December 31, 2005 compared with $50 billion at
December 31, 2004.
• Our expansion into the greater Washington, D.C. area in
the second quarter of 2005 has resulted in solid growth,
with checking relationships increasing by 11% during the
last six months of 2005.
• In the fourth quarter of 2005, we completed the
acquisition of an additional 20% interest in our Merchant
Services business from First Data. This transaction gives
us a 60% ownership interest and positions us to take
advantage of the payment revenue sources from small
business customers. Results of this business are now
consolidated in our financial statements.
• Noninterest expense increased $44 million compared with
2004 and reflected the expansion into the greater
Washington, D.C. area. Retail Banking’ s efficiency ratio
improved to 60% compared with 62% a year earlier.
• Credit quality remained strong and stable. Net charge-
offs as a percentage of average loan outstandings were
.23% for 2005 compared with .32% in 2004.
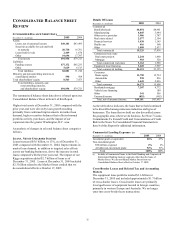
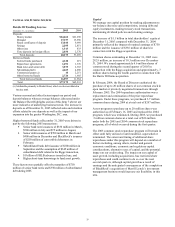
Total revenue for 2005 was $2.857 billion compared with
$2.694 billion for the same period last year. Taxable-
equivalent net interest income of $1.582 billion increased
$111 million, or 8%, compared with 2004 due to a 10%
increase in average deposits and a 14% increase in average
loan balances. The net interest income growth has been
somewhat mitigated by a narrower spread between loan yields
and deposit costs.
Noninterest income increased $52 million, or 4%, compared
with 2004 primarily driven by increased asset management
revenue, service charges on deposits and consumer service
fees. Growth in the latter two areas can be attributed mainly
to a growing customer base. Increases in noninterest income
were partially offset by:
• A decrease in gains from sales of education loans of
$11 million compared with 2004;
• A $10 million pretax gain from the sale of certain
investment consulting activities of Hawthorn
recognized in 2004; and
• Lower ATM surcharge revenue in 2005 from
changing customer behaviors and a strategic decision
to reduce the out-of-footprint ATM network.
The provision for credit losses declined $9 million in 2005
compared with 2004 primarily due to a one-time impact in the
first quarter of 2004 associated with the decision to change the
charge-off policy related to smaller nonperforming
commercial loans. Overall credit quality remained strong as
evidenced by the decline in nonperforming loans as a
percentage of total loans to .33% as of December 31, 2005
compared with .41% at the same time last year. We expect
that the provision for credit losses will increase with loan
growth. We have not been and we do not expect to be
materially impacted by the recent changes in the federal
bankruptcy laws.
Noninterest expense in 2005 totaled $1.715 billion, an
increase of $44 million, or 3%, compared with 2004. Retail
Banking incurred approximately $74 million in operating
costs as a result of the expansion into the greater Washington,
D.C. area in 2005 and recognized $11 million in nonrecurring
costs in 2004 associated with the United National acquisition.
Excluding the impact of these expenses, noninterest expense
declined $19 million compared with 2004. This decline was
reflected primarily in staff expense as a result of One PNC
initiatives.
Full-time employees at December 31, 2005 totaled 11,703, a
decline of 97 from December 31, 2004. The expansion into
the greater Washington, D.C. area accounted for an increase in
full-time employees of 621 at December 31, 2005. Excluding
the impact of this expansion on full-time employees, the
number of Retail Banking full-time employees at December
31, 2005 declined 6% compared with December 31, 2004.
We have adopted a relationship-based lending strategy to
target specific customer sectors (homeowners, small
businesses and auto dealerships) while seeking to maintain a
moderate risk profile in the loan portfolio.
• Average home equity loans grew by $1.7 billion, or
15%, compared with 2004. The increase was
attributable to $1.3 billion from organic loan growth,
$.3 billion from expansion into the greater
Washington, D.C. area and $.1 billion from portfolio
purchases. Consumer loan demand is starting to slow
as a result of the rising rate environment.
• Average commercial loans grew 14% on the strength
of increased loan demand from existing small
business customers and the acquisition of new
relationships through our sales efforts. New loan
volume in the small business arena increased 16%
over 2004.