PNC Bank 2005 Annual Report Download - page 114
Download and view the complete annual report
Please find page 114 of the 2005 PNC Bank annual report below. You can navigate through the pages in the report by either clicking on the pages listed below, or by using the keyword search tool below to find specific information within the annual report.-
 1
1 -
2
-
3
-
4
-
5
-
6
-
7
-
8
-
9
-
10
-
11
-
12
-
13
-
14
-
15
-
16
-
17
-
18
-
19
-
20
-
21
-
22
-
23
-
24
-
25
-
26
-
27
-
28
-
29
-
30
-
31
-
32
-
33
-
34
-
35
-
36
-
37
-
38
-
39
-
40
-
41
-
42
-
43
-
44
-
45
-
46
-
47
-
48
-
49
-
50
-
51
-
52
-
53
-
54
-
55
-
56
-
57
-
58
-
59
-
60
-
61
-
62
-
63
-
64
-
65
-
66
-
67
-
68
-
69
-
70
-
71
-
72
-
73
-
74
-
75
-
76
-
77
-
78
-
79
-
80
-
81
-
82
-
83
-
84
-
85
-
86
-
87
-
88
-
89
-
90
-
91
-
92
-
93
-
94
-
95
-
96
-
97
-
98
-
99
-
100
-
101
-
102
-
103
-
 104
104 -
 105
105 -
 106
106 -
 107
107 -
 108
108 -
 109
109 -
 110
110 -
 111
111 -
 112
112 -
 113
113 -
 114
114 -
 115
115 -
 116
116 -
 117
117 -
 118
118 -
 119
119 -
 120
120 -
 121
121 -
 122
122 -
 123
123 -
 124
124 -
125
-
126
-
127
-
128
-
129
-
130
-
131
-
132
-
133
-
134
-
135
-
136
-
137
-
138
-
139
-
140
-
141
-
142
-
143
-
144
-
145
-
146
-
147
-
148
-
149
-
150
-
151
-
152
-
153
-
154
-
155
-
156
-
157
-
158
-
159
-
160
-
161
-
162
-
163
-
164
-
165
-
166
-
167
-
168
-
169
-
170
-
171
-
172
-
173
-
174
-
175
-
176
-
177
-
178
-
179
-
180
-
181
-
182
-
183
-
184
-
185
-
186
-
187
-
188
-
189
-
190
-
191
-
192
-
193
-
194
-
195
-
196
-
197
-
198
-
199
-
200
-
201
-
202
-
203
-
204
-
205
-
206
-
207
-
208
-
209
-
210
-
211
-
212
-
213
-
214
-
215
-
216
-
217
-
218
-
219
-
220
-
221
-
222
-
223
-
224
-
225
-
226
-
227
-
228
-
229
-
230
-
231
-
232
-
233
-
234
-
235
-
236
-
237
-
238
-
239
-
240
-
241
-
242
-
243
-
244
-
245
-
246
-
247
-
248
-
249
-
250
-
251
-
252
-
253
-
254
-
255
-
256
-
257
-
258
-
259
-
260
-
261
-
262
-
263
-
264
-
265
-
266
-
267
-
268
-
269
-
270
-
271
-
272
-
273
-
274
-
275
-
276
-
277
-
278
-
279
-
280
-
281
-
282
-
283
-
284
-
285
-
286
-
287
-
288
-
289
-
290
-
291
-
292
-
293
-
294
-
295
-
296
-
297
-
298
-
299
-
300
 |
 |

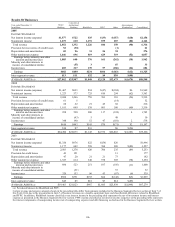
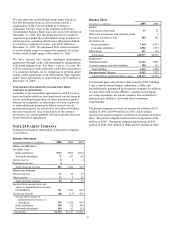
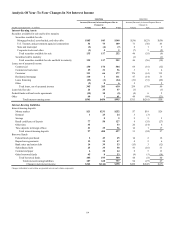
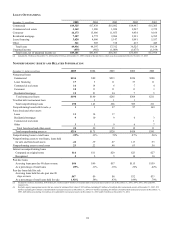
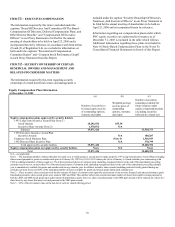
Analysis Of Year-To-Year Changes In Net Interest Income
Taxable-equivalent basis - in millions Volume Rate Total Volume Rate Total
Interest-Earning Assets
Securities available for sale and held to maturity
Securities available for sale
Mortgage-backed, asset-backed, and other debt $105 $43 $148 $(36) $(23) $(59)
U.S. Treasury and government agencies/corporations 34 75 109 73 (30) 43
State and municipal (3) (4) (7) 8 1 9
Corporate stocks and other (3) 5 2 (7) 5(2)
Total securities available for sale 135 117 252 46 (55) (9)
Securities held to maturity (1) (1)
Total securities available for sale and held to maturity 135 117 252 46 (56) (10)
Loans, net of unearned income
Commercial 130 174 304 69 (81) (12)
Commercial real estate 25 31 56 3 1 4
Consumer 111 66 177 176 (61) 115
Residential mortgage 110 1 111 47 (14) 33
Lease financing (23) (1) (24) (31) (31) (62)
Other (2) 8 6 2 2
Total loans, net of unearned income 345 285 630 259 (179) 80
Loans held for sale 24 33 57 (1) (1)
Federal funds sold and resale agreements (15) 10 (5) (4) 6 2
Other 60 1 61 48 (69) (21)
Total interest-earning assets
$541
$454
$995
$311 $(261) $50
Interest-Bearing Liabilities
Interest-bearing deposits
Money market $21 $231 $252 $7 $19 $26
Demand 1 23 24 3(3)
Savings 5 5 2 3 5
Retail certificates of deposit 77 50 127 8(35) (27)
Other time 33 33 20 (14) 6
Time deposits in foreign offices 21 35 56 16 1 17
Total interest-bearing deposits 97 400 497 51 (24) 27
Borrowed funds
Federal funds purchased 2 43 45 14 2 16
Repurchase agreements 13 34 47 426
Bank notes and senior debt 14 39 53 (15) 3(12)
Subordinated debt 23 35 58 41 (10) 31
Commercial paper 6 38 44 8 5 13
Other borrowed funds 45 8 53 (9) (5) (14)
Total borrowed funds 105 195 300 48 (8) 40
Total interest-bearing liabilities 187 610 797 94 (27) 67
Change in net interest income
$342
$(144)
$198
$228 $(245) $(17)
Changes attributable to rate/volume are prorated into rate and volume components.
114
Increase/(Decrease) in Income/Expense Due to
Changes in:
Increase/(Decrease) in Income/Expense Due to
Changes in:
2005/2004 2004/2003