PNC Bank 2005 Annual Report Download - page 85
Download and view the complete annual report
Please find page 85 of the 2005 PNC Bank annual report below. You can navigate through the pages in the report by either clicking on the pages listed below, or by using the keyword search tool below to find specific information within the annual report.
85
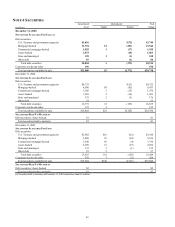
Securities represented 23% of total assets at December 31,
2005 compared with 21% at December 31, 2004 and 23% at
December 31, 2003.
At December 31, 2005 and 2004, our most significant
concentration of credit risk related to investments issued by the
US Government and its agencies. This exposure amounted to
$3.7 billion at December 31, 2005 and $4.7 billion at
December 31, 2004.
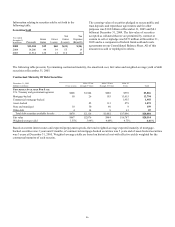
At December 31, 2005, the securities available for sale balance
included a net unrealized loss of $370 million, which
represented the difference between fair value and amortized
cost. The comparable amounts at December 31, 2004 and
December 31, 2003 were net unrealized losses of $102 million
and net unrealized gains of $4 million, respectively. The impact
on bond prices of increases in interest rates during 2005 was
reflected in the net unrealized loss position at Decemb er 31, 2005.
The fair value of securities available for sale decreases when
interest rates increase and vice versa. Net unrealized gains and
losses in the securities available for sale portfolio are included
in shareholders’ equity as accumulated other comprehensive
income or loss, net of tax.
The expected weighted-average life of securities available for
sale was 4 years and 1 month at December 31, 2005, 2 years
and 8 months at December 31, 2004, and 2 years and 11
months at December 31, 2003.
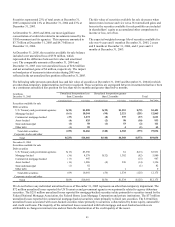
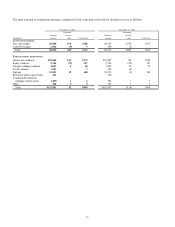
The following table presents unrealized loss and fair value of securities at December 31, 2005 and December 31, 2004 for which
an other-than-temporary impairment has not been recognized. These securities are segregated between investments that have been
in a continuous unrealized loss position for less than twelve months and greater than twelve months.
In millions
December 31, 2005
Unrealized loss position less
than 12 months
Unrealized loss position greater
than 12 months Total
Unrealized Loss Fair Value Unrealized Loss Fair Value Unrealized Loss Fair Value
Securities available for sale
Debt securities
U.S. Treasury and government agencies $(33) $1,898 $(39) $1,553 $(72) $3,451
Mortgage-backed (161) 10,544 (90) 2,321 (251) 12,865
Commercial mortgage-backed (29) 1,272 (8) 339 (37) 1,611
Asset-backed (8) 835 (2) 98 (10) 933
State and municipal (1) 58 (1) 53 (2) 111
Other debt (1) 59 4 (1) 63
Total debt securities (233) 14,666 (140) 4,368 (373) 19,034
Corporate stocks and other
Total $(233) $14,666 $(140) $4,368 $(373) $19,034
December 31, 2004
Securities available for sale
Debt securities
U.S. Treasury and government agencies $(13) $3,930 $1 $(13) $3,931
Mortgage-backed (30) 4,578 $(52) 1,302 (82) 5,880
Commercial mortgage-backed (15) 947 (15) 947
Asset-backed (10) 1,096 (4) 230 (14) 1,326
State and municipal (1) 82 (1) 82
Other debt 8 1 9
Total debt securities (69) 10,641 (56) 1,534 (125) 12,175
Corporate stocks and other
Total $(69) $10,641 $(56) $1,534 $(125) $12,175
We do not believe any individual unrealized loss as of December 31, 2005 represents an other-than-temporary impairment. The
$72 million unrealized losses reported for US Treasuries and government agencies were primarily related to agency debenture
securities. The $251 million unrealized losses reported for mortgage-backed securities relate primarily to securities issued by the
Federal National Mortgage Association, the Federal Home Loan Mortgage Corporation and private institutions. The $37 million
unrealized losses reported for commercial mortgage-backed securities relate primarily to fixed rate securities. The $10 million
unrealized losses associated with asset-backed securities relate primarily to securities collateralized by home equity, automobile
and credit card loans. The majority of the unrealized losses associated with both mortgage and asset-backed securities are
attributable to changes in interest rates and not from the deterioration of the credit quality of the issuer.


