PNC Bank 2005 Annual Report Download - page 91
Download and view the complete annual report
Please find page 91 of the 2005 PNC Bank annual report below. You can navigate through the pages in the report by either clicking on the pages listed below, or by using the keyword search tool below to find specific information within the annual report.-
 1
1 -
2
-
3
-
4
-
5
-
6
-
7
-
8
-
9
-
10
-
11
-
12
-
13
-
14
-
15
-
16
-
17
-
18
-
19
-
20
-
21
-
22
-
23
-
24
-
25
-
26
-
27
-
28
-
29
-
30
-
31
-
32
-
33
-
34
-
35
-
36
-
37
-
38
-
39
-
40
-
41
-
42
-
43
-
44
-
45
-
46
-
47
-
48
-
49
-
50
-
51
-
52
-
53
-
54
-
55
-
56
-
57
-
58
-
59
-
60
-
61
-
62
-
63
-
64
-
65
-
66
-
67
-
68
-
69
-
70
-
71
-
72
-
73
-
74
-
75
-
76
-
77
-
78
-
79
-
80
-
 81
81 -
 82
82 -
 83
83 -
 84
84 -
 85
85 -
 86
86 -
 87
87 -
 88
88 -
 89
89 -
 90
90 -
 91
91 -
 92
92 -
 93
93 -
 94
94 -
 95
95 -
 96
96 -
 97
97 -
 98
98 -
 99
99 -
 100
100 -
 101
101 -
102
-
103
-
104
-
105
-
106
-
107
-
108
-
109
-
110
-
111
-
112
-
113
-
114
-
115
-
116
-
117
-
118
-
119
-
120
-
121
-
122
-
123
-
124
-
125
-
126
-
127
-
128
-
129
-
130
-
131
-
132
-
133
-
134
-
135
-
136
-
137
-
138
-
139
-
140
-
141
-
142
-
143
-
144
-
145
-
146
-
147
-
148
-
149
-
150
-
151
-
152
-
153
-
154
-
155
-
156
-
157
-
158
-
159
-
160
-
161
-
162
-
163
-
164
-
165
-
166
-
167
-
168
-
169
-
170
-
171
-
172
-
173
-
174
-
175
-
176
-
177
-
178
-
179
-
180
-
181
-
182
-
183
-
184
-
185
-
186
-
187
-
188
-
189
-
190
-
191
-
192
-
193
-
194
-
195
-
196
-
197
-
198
-
199
-
200
-
201
-
202
-
203
-
204
-
205
-
206
-
207
-
208
-
209
-
210
-
211
-
212
-
213
-
214
-
215
-
216
-
217
-
218
-
219
-
220
-
221
-
222
-
223
-
224
-
225
-
226
-
227
-
228
-
229
-
230
-
231
-
232
-
233
-
234
-
235
-
236
-
237
-
238
-
239
-
240
-
241
-
242
-
243
-
244
-
245
-
246
-
247
-
248
-
249
-
250
-
251
-
252
-
253
-
254
-
255
-
256
-
257
-
258
-
259
-
260
-
261
-
262
-
263
-
264
-
265
-
266
-
267
-
268
-
269
-
270
-
271
-
272
-
273
-
274
-
275
-
276
-
277
-
278
-
279
-
280
-
281
-
282
-
283
-
284
-
285
-
286
-
287
-
288
-
289
-
290
-
291
-
292
-
293
-
294
-
295
-
296
-
297
-
298
-
299
-
300
 |
 |

91
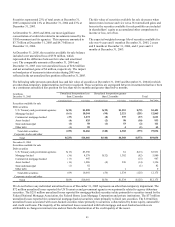
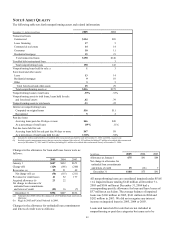
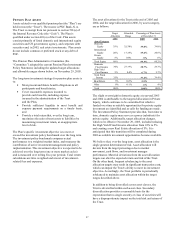
Amortization expense on intangible assets for 2005, 2004 and
2003 was $74 million, $52 million and $47 million,
respectively. Amortization expense on existing intangible
assets for 2006 through 2010 is estimated to be as follows:
• 2006: $97 million,
• 2007: $89 million,
• 2008: $86 million,
• 2009: $80 million, and
• 2010: $61 million.
We conduct an annual goodwill impairment test on our
reporting units. We conducted this review during the fourth
quarter of 2005, using data from September 30, 2005. Aside
from any adverse triggering events that may occur earlier in the
year, we will perform an annual test during the fourth quarter of
each year. The fair value of our reporting units is determined by
using discounted cash flow and market comparability
methodologies.
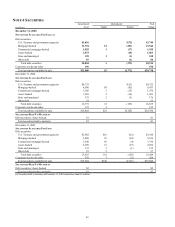
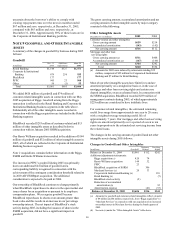
NOTE 10 PREMISES , EQUIPMENT AND
LEASEHOLD IMPROVEMENTS
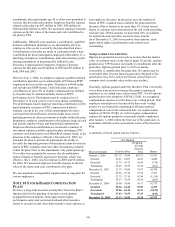
Premises, equipment and leasehold improvements, stated at
cost less accumulated depreciation and amortization, were as
follows:
December 31
-
in millions
2005
2004
Land $186 $97
Buildings 881 809
Equipment 1,735 1,514
Leasehold improvements 453 423
Total
3,255
2,843
Accumulated depreciation and
amortization (1,538) (1,361)
Net book value $1,717 $1,482
Depreciation expense on premises, equipment and leasehold
improvements totaled $192 million in 2005, $159 million in
2004 and $160 million in 2003. Amortization expense,
primarily for capitalized internally developed software, was
$43 million in both 2005 and 2004 and $36 million in 2003.
We lease certain facilities and equipment under agreements
expiring at various dates through the year 2071. We account
for substantially all such leases as operating leases. Rental
expense on such leases amounted to $189 million in 2005,
$174 million in 2004 and $177 million in 2003.
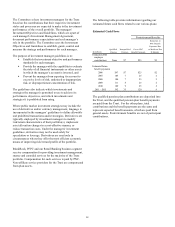
Required minimum annual rentals that we owe on
noncancelable leases having initial or remaining terms in
excess of one year totaled $998 million at December 31,
2005 and $950 million at December 31, 2004. Minimu m
annual rentals for the years 2006 through 2010 and thereafter
are as follows:
• 2006: $152 million,
• 2007: $135 million,
• 2008: $120 million,
• 2009: $104 million, and
• 2010 and thereafter: $487 million.
During 2003, we recognized facilities charges of $25 million,
of which $4 million is included in depreciation expense
above, related to leased space consistent with the
requirements of SFAS 146, “Accounting for Costs Associated
with Exit or Disposal Activities.”
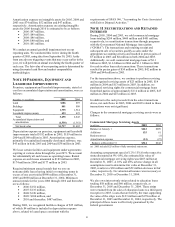
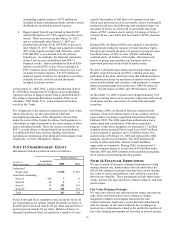
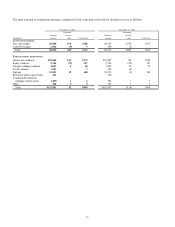
NOTE 11 SECURITIZATIONS AND RETAINED
INTERESTS
During 2005, 2004 and 2003, we sold commercial mortgage
loans totaling $284 million, $460 million and $401 million,
respectively, in securitization transactions through programs
with the Government National Mortgage Association
(“GNMA”). The transactions and resulting receipt and
subsequent sale of securities qualify as sales under the
appropriate accounting criteria and resulted in pretax gains of
$7 million in 2005 and $8 million in both 2004 and 2003.
Additionally, we sold commercial mortgage loans of $3.1
billion in 2005, $1.6 billion in 2004 and $1.1 billion in 2003
for cash in other loan sales transactions. These transactions
resulted in pretax gains of $54 million in 2005, $42 million in
2004 and $44 million in 2003.
For the transactions above, we continue to perform servicing
and recognized servicing assets of $23 million in 2005, $14
million in 2004 and $13 million in 2003. In addition, we
purchased servicing rights for commercial mortgage loans
from third parties of approximately $112 million in 2005, $47
million in 2004 and $23 million in 2003.
In addition to the cash proceeds from the sales transactions
above, net cash flows in 2005, 2004 and 2003 related to those
transactions were not significant.
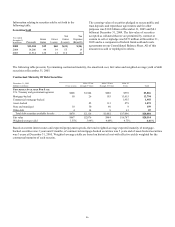
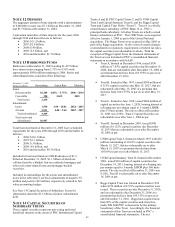
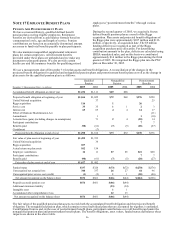
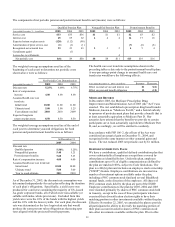
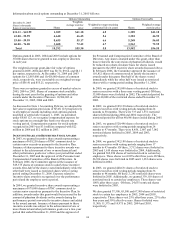
Changes in the commercial mortgage servicing assets were as
follows:
Commercial Mortgage Servicing Assets
In millions 2005 2004
Balance at January 1 $242 $209
Additions 135 61
Retirements (a) (1)
Amortization expense (33)
(27)
Balance at December 31 $344 $242
(a) 2005 included $25 million of fully amortized retirements.
Assuming a prepayment speed of 12%-15% for the respective
strata discounted at 9%-10%, the estimated fair value of
commercial mortgage servicing rights was $403 million at
December 31, 2005. A 10% and 20% adverse change in all
assumptions used to determine fair value at December 31,
2005, results in a $30 million and $59 million decrease in fair
value, respectively. No valuation allowance was necessary at
December 31, 2005 or December 31, 2004.
We also own interest-only strips related to education loans
totaling $58 million and $60 million, respectively, at
December 31, 2005 and December 31, 2004. These strips
were retained from the sales of education loans to a third party
trust prior to 2003. Loans that are held by the trust supporting
the value of the strips were $123 million and $178 million at
December 31, 2005 and December 31, 2004, respectively. The
principal of these loans is effectively guaranteed by the
federal government.