PNC Bank 2005 Annual Report Download - page 40
Download and view the complete annual report
Please find page 40 of the 2005 PNC Bank annual report below. You can navigate through the pages in the report by either clicking on the pages listed below, or by using the keyword search tool below to find specific information within the annual report.-
 1
1 -
2
-
3
-
4
-
5
-
6
-
7
-
8
-
9
-
10
-
11
-
12
-
13
-
14
-
15
-
16
-
17
-
18
-
19
-
20
-
21
-
22
-
23
-
24
-
25
-
26
-
27
-
28
-
29
-
 30
30 -
 31
31 -
 32
32 -
 33
33 -
 34
34 -
 35
35 -
 36
36 -
 37
37 -
 38
38 -
 39
39 -
 40
40 -
 41
41 -
 42
42 -
 43
43 -
 44
44 -
 45
45 -
 46
46 -
 47
47 -
 48
48 -
 49
49 -
 50
50 -
51
-
52
-
53
-
54
-
55
-
56
-
57
-
58
-
59
-
60
-
61
-
62
-
63
-
64
-
65
-
66
-
67
-
68
-
69
-
70
-
71
-
72
-
73
-
74
-
75
-
76
-
77
-
78
-
79
-
80
-
81
-
82
-
83
-
84
-
85
-
86
-
87
-
88
-
89
-
90
-
91
-
92
-
93
-
94
-
95
-
96
-
97
-
98
-
99
-
100
-
101
-
102
-
103
-
104
-
105
-
106
-
107
-
108
-
109
-
110
-
111
-
112
-
113
-
114
-
115
-
116
-
117
-
118
-
119
-
120
-
121
-
122
-
123
-
124
-
125
-
126
-
127
-
128
-
129
-
130
-
131
-
132
-
133
-
134
-
135
-
136
-
137
-
138
-
139
-
140
-
141
-
142
-
143
-
144
-
145
-
146
-
147
-
148
-
149
-
150
-
151
-
152
-
153
-
154
-
155
-
156
-
157
-
158
-
159
-
160
-
161
-
162
-
163
-
164
-
165
-
166
-
167
-
168
-
169
-
170
-
171
-
172
-
173
-
174
-
175
-
176
-
177
-
178
-
179
-
180
-
181
-
182
-
183
-
184
-
185
-
186
-
187
-
188
-
189
-
190
-
191
-
192
-
193
-
194
-
195
-
196
-
197
-
198
-
199
-
200
-
201
-
202
-
203
-
204
-
205
-
206
-
207
-
208
-
209
-
210
-
211
-
212
-
213
-
214
-
215
-
216
-
217
-
218
-
219
-
220
-
221
-
222
-
223
-
224
-
225
-
226
-
227
-
228
-
229
-
230
-
231
-
232
-
233
-
234
-
235
-
236
-
237
-
238
-
239
-
240
-
241
-
242
-
243
-
244
-
245
-
246
-
247
-
248
-
249
-
250
-
251
-
252
-
253
-
254
-
255
-
256
-
257
-
258
-
259
-
260
-
261
-
262
-
263
-
264
-
265
-
266
-
267
-
268
-
269
-
270
-
271
-
272
-
273
-
274
-
275
-
276
-
277
-
278
-
279
-
280
-
281
-
282
-
283
-
284
-
285
-
286
-
287
-
288
-
289
-
290
-
291
-
292
-
293
-
294
-
295
-
296
-
297
-
298
-
299
-
300
 |
 |

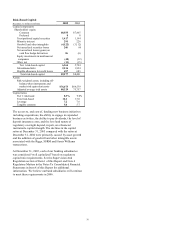
40
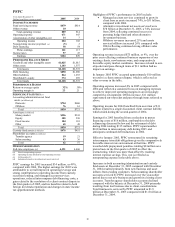
PFPC
Year ended December 31
Dollars in millions except as noted 2005 2004
INCOME STATEMENT
Fund servicing revenue $879 $814
Other revenue 10
Total operating revenue 889 814
Operating expense 671 643
Amortization of other intangibles, net 14 3
Operating income 204 168
Nonoperating income (expense) (a) (5) 3
Debt financing 38 54
Pretax earnings 161 117
Income taxes 57 47
Earnings $104 $70
PERIOD-END BALANCE SHEET
Goodwill and other intangible assets $1,025 $1,015
Other assets 1,103 1,557
Total assets $2,128 $2,572
Debt financing $890 $1,050
Other liabilities 864 1,253
Shareholder’ s equity 374 269
Total funds $2,128 $2,572
PERFORMANCE RATIOS
Return on average equity 32% 30%
Operating margin (b) 23 21
SERVICING STATISTICS (C)
Accounting/administration net fund
assets (in billions) (d)
Domestic $754 $660
Offshore 76 61
Total $830 $721
Asset type (in billions)
Money market $356 $341
Equity 305 230
Fixed income 104 101
Other 65 49
Total $830 $721
Custody fund assets (in billions) $476 $451
Shareholder accounts (in millions)
Transfer agency 19 21
Subaccounting 43 36
Total 62 57
OTHER INFORMATION
Full-time employees (c) 4,391 4,460
(a) Net of nonoperating expense.
(b) Operating income divided by total operating revenue.
(c) At December 31.
(d) Includes alternative investment net assets serviced.
PFPC earnings for 2005 increased $34 million, or 49%,
compared with 2004. The higher earnings for 2005 were
attributable to overall improved operating leverage and
strong contributions to operating income from custody,
securities lending, and managed account services
operations, reduced intercompany debt financing costs, a
gain related to the resolution of a client contract dispute in
the first quarter of 2005, and tax benefits related to both
foreign dividends repatriation and changes in state income
tax apportionment methods.
Highlights of PFPC’ s performance in 2005 include:
• Managed account services continued to grow its
client base as assets increased 74%, to $51 billion,
compared with 2004.
• Alternative investment net assets serviced were
$78 billion at December 31, 2005, a 74% increase
from 2004, reflecting continued success in
pursuing hedge fund and other alternative
investment business.
• Offshore revenues increased 25% and assets
serviced offshore increased 26% compared with
2004 reflecting continued strong offshore sales
performance.
Operating revenue increased $75 million, or 9%, over the
prior year reflecting continued business expansion of our
existing clients, new business wins, and comp aratively
favorable equity market conditions. Increases related to out-
of-pocket and pass-through items of $11 million had no
impact on earnings.
In January 2005 PFPC accepted approximately $10 million
to resolve a client contract dispute, which is reflected as
other revenue in the table.
Operating expense increased 4% in 2005 compared with
2004 and reflected a sustained focus on managing expenses
to achieve improved operating margins in an increasingly
competitive environment. Of this increase, $11 million
represented out-of-pocket and pass-through items referred to
above.
Operating income for 2004 benefited from accretion of $11
million related to a single discounted client contract liability
which ended during the second quarter of 2004.
Earnings for 2005 benefited from a reduction in pretax
financing costs of $16 million, attributable to the debt
refinancing discussed below and the retirement of debt
during 2004 totaling $115 million. PFPC repaid another
$160 million in intercompany debt during 2005 and
anticipates continued debt reductions in 2006.
Effective January 2005, PFPC restructured its remaining
intercompany term debt obligations given the comparatively
favorable interest rate environment at that time. PFPC
recorded debt prepayment penalties totaling $8 million on a
pretax basis in the first quarter of 2005 to effect the
restructuring, which was more than offset by resulting
interest expense savings. This cost is reflected as
nonoperating expense in the table above.
Increases in both accounting/administration and custody
fund assets at December 31, 2005 compared with December
31, 2004 resulted primarily from new business and asset
inflows from existing customers. Subaccounting shareholder
accounts serviced by PFPC increased over the year-earlier
period due to net new business and growth in existing client
accounts. Transfer agency shareholder accounts declined
compared with the balance at December 31, 2004 primarily
resulting from lost business due to client consolidations.
Total fund assets serviced by PFPC amounted to $1.9
trillion at December 31, 2005 compared with $1.8 trillion at
December 31, 2004.