PNC Bank 2005 Annual Report Download - page 104
Download and view the complete annual report
Please find page 104 of the 2005 PNC Bank annual report below. You can navigate through the pages in the report by either clicking on the pages listed below, or by using the keyword search tool below to find specific information within the annual report.-
 1
1 -
2
-
3
-
4
-
5
-
6
-
7
-
8
-
9
-
10
-
11
-
12
-
13
-
14
-
15
-
16
-
17
-
18
-
19
-
20
-
21
-
22
-
23
-
24
-
25
-
26
-
27
-
28
-
29
-
30
-
31
-
32
-
33
-
34
-
35
-
36
-
37
-
38
-
39
-
40
-
41
-
42
-
43
-
44
-
45
-
46
-
47
-
48
-
49
-
50
-
51
-
52
-
53
-
54
-
55
-
56
-
57
-
58
-
59
-
60
-
61
-
62
-
63
-
64
-
65
-
66
-
67
-
68
-
69
-
70
-
71
-
72
-
73
-
74
-
75
-
76
-
77
-
78
-
79
-
80
-
81
-
82
-
83
-
84
-
85
-
86
-
87
-
88
-
89
-
90
-
91
-
92
-
93
-
 94
94 -
 95
95 -
 96
96 -
 97
97 -
 98
98 -
 99
99 -
 100
100 -
 101
101 -
 102
102 -
 103
103 -
 104
104 -
 105
105 -
 106
106 -
 107
107 -
 108
108 -
 109
109 -
 110
110 -
 111
111 -
 112
112 -
 113
113 -
 114
114 -
115
-
116
-
117
-
118
-
119
-
120
-
121
-
122
-
123
-
124
-
125
-
126
-
127
-
128
-
129
-
130
-
131
-
132
-
133
-
134
-
135
-
136
-
137
-
138
-
139
-
140
-
141
-
142
-
143
-
144
-
145
-
146
-
147
-
148
-
149
-
150
-
151
-
152
-
153
-
154
-
155
-
156
-
157
-
158
-
159
-
160
-
161
-
162
-
163
-
164
-
165
-
166
-
167
-
168
-
169
-
170
-
171
-
172
-
173
-
174
-
175
-
176
-
177
-
178
-
179
-
180
-
181
-
182
-
183
-
184
-
185
-
186
-
187
-
188
-
189
-
190
-
191
-
192
-
193
-
194
-
195
-
196
-
197
-
198
-
199
-
200
-
201
-
202
-
203
-
204
-
205
-
206
-
207
-
208
-
209
-
210
-
211
-
212
-
213
-
214
-
215
-
216
-
217
-
218
-
219
-
220
-
221
-
222
-
223
-
224
-
225
-
226
-
227
-
228
-
229
-
230
-
231
-
232
-
233
-
234
-
235
-
236
-
237
-
238
-
239
-
240
-
241
-
242
-
243
-
244
-
245
-
246
-
247
-
248
-
249
-
250
-
251
-
252
-
253
-
254
-
255
-
256
-
257
-
258
-
259
-
260
-
261
-
262
-
263
-
264
-
265
-
266
-
267
-
268
-
269
-
270
-
271
-
272
-
273
-
274
-
275
-
276
-
277
-
278
-
279
-
280
-
281
-
282
-
283
-
284
-
285
-
286
-
287
-
288
-
289
-
290
-
291
-
292
-
293
-
294
-
295
-
296
-
297
-
298
-
299
-
300
 |
 |

104
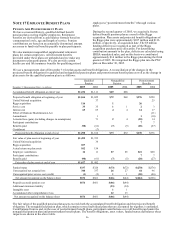
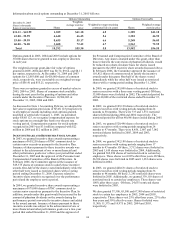
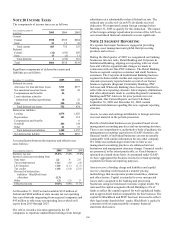
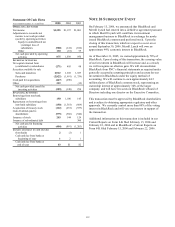
NOTE 20 INCOME TAXES
The components of income taxes are as follows:
Year ended December 31
In millions 2005
2004
2003
Current
Federal
$550
$720
$284
State
53
12
39
Total current
603
732
323
Deferred
Federal
(12)
(192)
205
State
13
(2)
11
Total deferred 1
(194)
216
Total $604
$538
$539
Significant components of deferred tax assets and
liabilities are as follows:
December 31
-
in millions
2005
2004
Deferred tax assets
Allowance for loan and lease losses
$311
$277
Net unrealized securities losses
135
42
Compensation and benefits
56
Loan valuations related to
institutional lending repositioning 10 25
Other
240
130
Total deferred tax assets 752 474
Deferred tax liabilities
Leasing 1,078 1,022
Depreciation 103 114
Compensation and benefits
6
Goodwill
206
144
Other
21
71
Total deferred tax liabilities 1,408 1,357
Net deferred tax liability $656 $883
A reconciliation between the statutory and effective tax
rates follows:
Year ended December 31 2005 2004 2003
Statutory tax rate 35.0%
35.0%
35.0%
Increases (decreases) resulting from
State taxes 2.2 .4 2.0
Tax-exempt interest (1.1) (.8) (.4)
Life insurance (1.0) (1.1) (1.3)
Tax credits (1.8) (2.4) (2.5)
Reversal of deferred tax
liabilities – BlackRock basis
allocation (2.3)
Other (.2) (.3) .9
Effective tax rate 30.8%
30.8%
33.7%
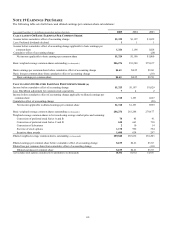
At December 31, 2005 we had available $135 million of
federal and $280 million of state income tax net operating
loss carryforwards originating from acquired companies and
$45 million in other state net operating losses which will
expire from 2019 through 2025.
The AJCA created a one-time opportunity for US
companies to repatriate undistributed earnings from foreign
subsidiaries at a substantially reduced federal tax rate. The
reduced rate is achieved via an 85% dividends received
deduction. We repatriated certain foreign earnings before
December 31, 2005 to qualify for this deduction. The impact
of the foreign earnings repatriation provision of the AJCA on
our consolidated financial statements was not significant.
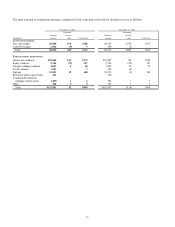
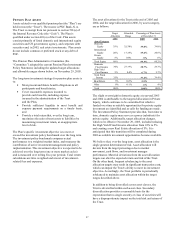
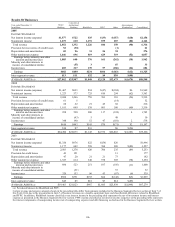
NOTE 21 SEGMENT REPORTING
We operate four major businesses engaged in providing
banking, asset management and global fund processing
products and services.
During the third quarter of 2005 we reorganized our banking
businesses into two units, Retail Banking and Corporate &
Institutional Banking, aligning our reporting with our client
base and with the organizational changes we made in
connection with our One PNC initiative. The Retail Banking
business segment comprises consumer and small business
customers. The Corporate & Institutional Banking business
segment includes middle market and corporate customers.
Amounts previously reported under several of our former
business segments (Regional Community Banking, PNC
Advisors and Wholesale Banking) have been reclassified to
reflect this new reporting structure. Intercompany eliminations
and other adjustments made to combine Regional Community
Banking and PNC Advisors for prior periods were not
significant. Our Current Reports on Form 8-K dated
September 30, 2005 and December 28, 2005 contain
additional information regarding this new segment reporting
structure.
Assets, revenue and earnings attributable to foreign activities
were not material in the periods presented.
Results of individual businesses are presented based on our
management accounting practices and our operating structure.
There is no comprehensive, authoritative body of guidance for
management accounting equivalent to GAAP; therefore, the
financial results of individual businesses are not necessarily
comparable with similar information for any other company.
We refine our methodologies from time to time as our
management accounting practices are enhanced and our
businesses and management structure change. Financial results
are presented, to the extent practicable, as if each business
operated on a stand-alone basis. As permitted under GAAP,
we have aggregated the business results for certain operating
segments for financial reporting purposes.
Assets receive a funding charge and liabilities and capital
receive a funding credit based on a transfer pricing
methodology that incorporates product maturities, duration
and other factors. Capital is intended to cover unexpected
losses and is assigned to the banking and processing
businesses using our risk-based economic capital model. We
increased the capital assigned to Retail Banking to 6% of
funds to reflect the capital required for well-capitalized banks
and to approximate market comparables for this business. The
capital for BlackRock and PFPC has been increased to reflect
their legal entity shareholders’ equity. BlackRock’ s capital is
consistent with its separate public company financial
statement disclosures.