PNC Bank 2005 Annual Report Download - page 22
Download and view the complete annual report
Please find page 22 of the 2005 PNC Bank annual report below. You can navigate through the pages in the report by either clicking on the pages listed below, or by using the keyword search tool below to find specific information within the annual report.-
 1
1 -
2
-
3
-
4
-
5
-
6
-
7
-
8
-
9
-
10
-
11
-
 12
12 -
 13
13 -
 14
14 -
 15
15 -
 16
16 -
 17
17 -
 18
18 -
 19
19 -
 20
20 -
 21
21 -
 22
22 -
 23
23 -
 24
24 -
 25
25 -
 26
26 -
 27
27 -
 28
28 -
 29
29 -
 30
30 -
 31
31 -
 32
32 -
33
-
34
-
35
-
36
-
37
-
38
-
39
-
40
-
41
-
42
-
43
-
44
-
45
-
46
-
47
-
48
-
49
-
50
-
51
-
52
-
53
-
54
-
55
-
56
-
57
-
58
-
59
-
60
-
61
-
62
-
63
-
64
-
65
-
66
-
67
-
68
-
69
-
70
-
71
-
72
-
73
-
74
-
75
-
76
-
77
-
78
-
79
-
80
-
81
-
82
-
83
-
84
-
85
-
86
-
87
-
88
-
89
-
90
-
91
-
92
-
93
-
94
-
95
-
96
-
97
-
98
-
99
-
100
-
101
-
102
-
103
-
104
-
105
-
106
-
107
-
108
-
109
-
110
-
111
-
112
-
113
-
114
-
115
-
116
-
117
-
118
-
119
-
120
-
121
-
122
-
123
-
124
-
125
-
126
-
127
-
128
-
129
-
130
-
131
-
132
-
133
-
134
-
135
-
136
-
137
-
138
-
139
-
140
-
141
-
142
-
143
-
144
-
145
-
146
-
147
-
148
-
149
-
150
-
151
-
152
-
153
-
154
-
155
-
156
-
157
-
158
-
159
-
160
-
161
-
162
-
163
-
164
-
165
-
166
-
167
-
168
-
169
-
170
-
171
-
172
-
173
-
174
-
175
-
176
-
177
-
178
-
179
-
180
-
181
-
182
-
183
-
184
-
185
-
186
-
187
-
188
-
189
-
190
-
191
-
192
-
193
-
194
-
195
-
196
-
197
-
198
-
199
-
200
-
201
-
202
-
203
-
204
-
205
-
206
-
207
-
208
-
209
-
210
-
211
-
212
-
213
-
214
-
215
-
216
-
217
-
218
-
219
-
220
-
221
-
222
-
223
-
224
-
225
-
226
-
227
-
228
-
229
-
230
-
231
-
232
-
233
-
234
-
235
-
236
-
237
-
238
-
239
-
240
-
241
-
242
-
243
-
244
-
245
-
246
-
247
-
248
-
249
-
250
-
251
-
252
-
253
-
254
-
255
-
256
-
257
-
258
-
259
-
260
-
261
-
262
-
263
-
264
-
265
-
266
-
267
-
268
-
269
-
270
-
271
-
272
-
273
-
274
-
275
-
276
-
277
-
278
-
279
-
280
-
281
-
282
-
283
-
284
-
285
-
286
-
287
-
288
-
289
-
290
-
291
-
292
-
293
-
294
-
295
-
296
-
297
-
298
-
299
-
300
 |
 |

22
LINE OF BUSINESS HIGHLIGHTS
We refer you to Item 1 of this Report for an overview of our
business segments in Review of Lines of Business. Total
business segment earnings were $1.5 billion for 2005 and
$1.3 billion for 2004.
Retail Banking
Retail Banking’ s earnings totaled $682 million for 2005, an
increase of $72 million, or 12%, compared with 2004.
Continued organic customer growth and the expansion into
the greater Washington, D.C. area drove a growing balance
sheet and a corresponding revenue increase of 6%. A
sustained focus on expense management and improving
credit quality also contributed to the 12% earnings growth.
Corporate & Institutional Banking
Earnings from Corporate & Institutional Banking were $480
million for 2005 and $443 million for 2004. The 8%
increase in earnings compared with 2004 was driven by
balance sheet growth, improved fee income despite
significantly lower gains on sales of institutional loans held
for sale, and a reduction in the provision for credit losses.
Our acquisition of Harris Williams in October 2005
contributed to increases in both revenues and expenses.
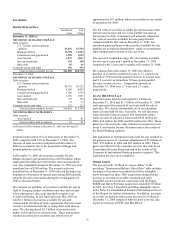
BlackRock
BlackRock reported earnings of $234 million for 2005 and
$143 million for 2004. Earnings growth in 2005 was
primarily due to performance fees on equity hedge fund and
real estate equity alternative products; higher assets under
management primarily as a result of organic growth and the
acquisition of SSRM; and an increase in BlackRock
Solutions revenue. Earnings for 2005 included $59 million
of pretax LTIP expenses and nonrecurring pretax expenses
of $9 million associated with the SSRM acquisition. Results
for 2004 included a $104 million pretax impact from the
LTIP expenses. See the 2002 BlackRock Long-Term
Retention and Incentive Plan section of Item 7 of this
Report for additional information regarding the BlackRock
LTIP. BlackRock’ s assets under management totaled $453
billion at December 31, 2005, an increase of 32% compared
with the prior year-end level. The increase was attributable
to the impact of the SSRM acquisition, net new
subscriptions and market appreciation.
PNC owns approximately 70% of BlackRock and we
consolidate BlackRock into our financial statements.
Accordingly, approximately 30% of BlackRock’ s earnings
are recognized as minority interest expense in the
Consolidated Income Statement. BlackRock financial
information in Item 7 of this Report is presented on a stand-
alone basis. The market value of our BlackRock shares was
approximately $4.8 billion at December 31, 2005, while the
book value at that date was approximately $700 million.
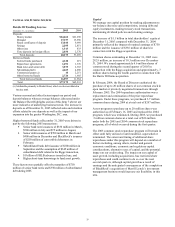
PFPC
PFPC earned $104 million for 2005 and $70 million for
2004. The 49% increase in earnings in 2005 was attributable
to improved operating leverage and strong performances
from custody, securities lending, and managed account
services operations, reduced intercompany debt financing
costs, a gain related to the resolution of a client contract
dispute in the first quarter of 2005, and tax benefits related
to foreign dividends repatriation and changes in state
income tax apportionment methods.
PFPC’ s accounting/administration net fund assets increased
15% and custody fund assets increased 6% as of December
31, 2005 compared with the balances at December 31, 2004.
The increases were driven by new business and asset
inflows from existing customers, as well as comparatively
favorable market conditions.
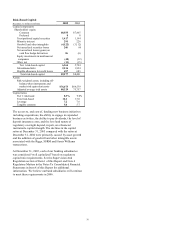
Other
The “Other” net loss for 2005 was $104 million compared with
a net loss of $27 million for 2004. The following factors, on an
after-tax basis, contributed to the higher net loss in 2005 within
“Other”:
• Net securities losses in 2005 of $27 million compared
with net securities gains of $38 million in 2004;
• Implementation costs related to the One PNC initiative
totaling $35 million in 2005;
• Riggs acquisition integration costs recognized in 2005
totaling $20 million; and
• The comparative impact of the first quarter 2004 gain
of $22 million from the sale of our modified
coinsurance contracts.
Partially offsetting the factors above were the following, on an
after-tax basis:
• The first quarter 2005 benefit of the $45 million
deferred tax liability reversal related to the internal
transfer of our investment in BlackRock, as referred to
above under “Summary Financial Results”; and
• The $19 million comparative increase in equity
management gains in 2005.