PNC Bank 2005 Annual Report Download - page 115
Download and view the complete annual report
Please find page 115 of the 2005 PNC Bank annual report below. You can navigate through the pages in the report by either clicking on the pages listed below, or by using the keyword search tool below to find specific information within the annual report.-
 1
1 -
2
-
3
-
4
-
5
-
6
-
7
-
8
-
9
-
10
-
11
-
12
-
13
-
14
-
15
-
16
-
17
-
18
-
19
-
20
-
21
-
22
-
23
-
24
-
25
-
26
-
27
-
28
-
29
-
30
-
31
-
32
-
33
-
34
-
35
-
36
-
37
-
38
-
39
-
40
-
41
-
42
-
43
-
44
-
45
-
46
-
47
-
48
-
49
-
50
-
51
-
52
-
53
-
54
-
55
-
56
-
57
-
58
-
59
-
60
-
61
-
62
-
63
-
64
-
65
-
66
-
67
-
68
-
69
-
70
-
71
-
72
-
73
-
74
-
75
-
76
-
77
-
78
-
79
-
80
-
81
-
82
-
83
-
84
-
85
-
86
-
87
-
88
-
89
-
90
-
91
-
92
-
93
-
94
-
95
-
96
-
97
-
98
-
99
-
100
-
101
-
102
-
103
-
104
-
 105
105 -
 106
106 -
 107
107 -
 108
108 -
 109
109 -
 110
110 -
 111
111 -
 112
112 -
 113
113 -
 114
114 -
 115
115 -
 116
116 -
 117
117 -
 118
118 -
 119
119 -
 120
120 -
 121
121 -
 122
122 -
 123
123 -
 124
124 -
 125
125 -
126
-
127
-
128
-
129
-
130
-
131
-
132
-
133
-
134
-
135
-
136
-
137
-
138
-
139
-
140
-
141
-
142
-
143
-
144
-
145
-
146
-
147
-
148
-
149
-
150
-
151
-
152
-
153
-
154
-
155
-
156
-
157
-
158
-
159
-
160
-
161
-
162
-
163
-
164
-
165
-
166
-
167
-
168
-
169
-
170
-
171
-
172
-
173
-
174
-
175
-
176
-
177
-
178
-
179
-
180
-
181
-
182
-
183
-
184
-
185
-
186
-
187
-
188
-
189
-
190
-
191
-
192
-
193
-
194
-
195
-
196
-
197
-
198
-
199
-
200
-
201
-
202
-
203
-
204
-
205
-
206
-
207
-
208
-
209
-
210
-
211
-
212
-
213
-
214
-
215
-
216
-
217
-
218
-
219
-
220
-
221
-
222
-
223
-
224
-
225
-
226
-
227
-
228
-
229
-
230
-
231
-
232
-
233
-
234
-
235
-
236
-
237
-
238
-
239
-
240
-
241
-
242
-
243
-
244
-
245
-
246
-
247
-
248
-
249
-
250
-
251
-
252
-
253
-
254
-
255
-
256
-
257
-
258
-
259
-
260
-
261
-
262
-
263
-
264
-
265
-
266
-
267
-
268
-
269
-
270
-
271
-
272
-
273
-
274
-
275
-
276
-
277
-
278
-
279
-
280
-
281
-
282
-
283
-
284
-
285
-
286
-
287
-
288
-
289
-
290
-
291
-
292
-
293
-
294
-
295
-
296
-
297
-
298
-
299
-
300
 |
 |

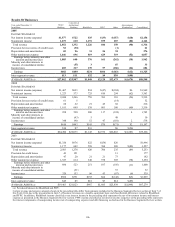
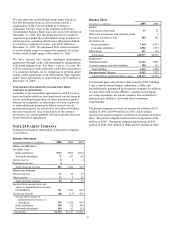
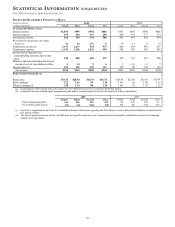
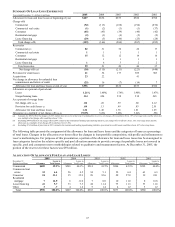
Average Consolidated Balance Sheet And Net Interest Analysis
Taxable-equivalent basis Average Interest Average Average Interest Average Average Interest Average
Dollars in millions Balances Income/Expense Yields/Rates Balances Income/Expense Yields/Rates Balances Income/Expense Yields/Rates
Assets
Interest-earning assets
Securities available for sale and held to maturity
Securities available for sale
Mortgage-backed, asset-backed, and other debt $11,376 $488 4.29 % $8,857 $340 3.84 %$9,754 $399 4.09 %
U.S. Treasury and government agencies/corporations 7,558 316 4.18 6,567 207 3.15 4,358 164 3.76
State and municipal 167 9 5.39 220 16 7.27 112 7 6.25
Corporate stocks and other 173 12 6.94 232 10 4.31 432 12 2.78
Total securities available for sale 19,274 825 4.28 15,876 573 3.61 14,656 582 3.97
Securities held to maturity 12 18 1 5.56
Total securities available for sale and held to maturity 19,275 825 4.28 15,878 573 3.61 14,674 583 3.97
Loans, net of unearned income
Commercial 19,007 1,142 6.01 16,627 838 5.04 15,336 850 5.54
Commercial real estate 2,609 158 6.06 2,137 102 4.77 2,072 98 4.73
Consumer 16,208 905 5.58 14,165 728 5.14 10,807 613 5.67
Residential mortgage 6,136 321 5.23 4,040 210 5.20 3,148 177 5.62
Lease financing 2,944 132 4.48 3,470 156 4.50 4,110 218 5.30
Other 453 22 4.86 506 16 3.16 444 14 3.15
Total loans, net of unearned income 47,357 2,680 5.66 40,945 2,050 5.01 35,917 1,970 5.48
Loans held for sale 2,301 104 4.52 1,636 47 2.87 1,664 48 2.88
Federal funds sold and resale agreements 985 25 2.54 1,670 30 1.80 1,954 28 1.43
Other 3,083 133 4.31 1,692 72 4.26 963 93 9.66
Total interest-earning assets/interest income 73,001 3,767 5.16 61,821 2,772 4.48 55,172 2,722 4.93
Noninterest-earning assets
Allowance for loan and lease losses (632) (608) (668)
Cash and due from banks 3,164 2,895 2,734
Other assets 13,015 11,158 10,041
Total assets $88,548 $75,266 $67,279
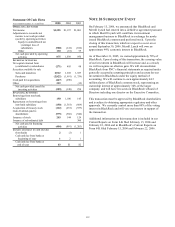
Liabilities, Minority and Noncontrolling Interests, Capital Securities and Shareholders' Equity
Interest-bearing liabilities
Interest-bearing deposits
Money market $17,930 403 2.25 $15,964 151 .95 $15,163 125 .82
Demand 8,224 56 .68 7,902 32 .40 7,197 32 .44
Savings 2,645 16 .60 2,684 11 .41 2,106 6 .28
Retail certificates of deposit 11,623 371 3.19 9,075 244 2.69 8,810 271 3.08
Other time 1,559 59 3.78 686 26 3.79 266 20 7.52
Time deposits in foreign offices 2,347 76 3.24 1,371 20 1.46 283 3 1.06
Total interest-bearing deposits 44,328 981 2.21 37,682 484 1.28 33,825 457 1.35
Borrowed funds
Federal funds purchased 2,098 71 3.38 1,957 26 1.33 904 10 1.11
Repurchase agreements 2,189 65 2.97 1,433 18 1.26 1,110 12 1.08
Bank notes and senior debt 3,198 114 3.56 2,687 61 2.27 3,364 73 2.17
Subordinated debt 4,044 197 4.87 3,506 139 3.96 2,510 108 4.30
Commercial paper 2,223 71 3.19 1,887 27 1.43 1,232 14 1.14
Other borrowed funds 2,447 81 3.31 1,045 28 2.68 1,371 42 3.06
Total borrowed funds 16,199 599 3.70 12,515 299 2.39 10,491 259 2.47
Total interest-bearing liabilities/interest expense 60,527 1,580 2.61 50,197 783 1.56 44,316 716 1.62
Noninterest-bearing liabilities, minority and noncontrolling
interests, capital securities and shareholders' equity
Demand and other noninterest-bearing deposits 13,309 12,015 10,637
Allowance for unfunded loan commitments
and letters of credit 80 90 82
Accrued expenses and other liabilities 6,098 5,389 4,855
Minority and noncontrolling interests in
consolidated entities 542 455 317
Mandatorily redeemable capital securities
of subsidiary trusts 421
Shareholders' equity 7,992 7,120 6,651
Total liabilities, minority and noncontrolling
interests, capital securities and shareholders' equity $88,548 $75,266 $67,279
Interest rate spread 2.55 2.92 3.31
Impact of noninterest-bearing sources .45 .30 .33
Net interest income/margin
$2,187
3.00
%
$1,989
3.22
%
$2,006
3.64
%
2003
115
Nonaccrual loans are included in loans, net of unearned income. The impact of financial derivatives used in interest rate risk management is included in the interest income/expense and average yields/rates of the related assets and liabilities. Basis
adjustments related to hedged items are included in noninterest-earning assets and noninterest-bearing liabilities. Average balances of securities are based on amortized historical cost (excluding SFAS 115 adjustments to fair value which are
included in other assets). Loan fees for the years ended December 31, 2005, 2004 and 2003 were $91 million, $109 million and $110 million, respectively. Interest income includes the effects of taxable-equivalent adjustments using amarginal
federal income tax rate of 35% to increase tax-exempt interest income to ataxable-equivalent basis. The taxable-equivalent adjustments to interest income for the years ended December 31, 2005, 2004 and 2003 were $33 million, $20 million and
$10 million, respectively.
2005 2004