PNC Bank 2005 Annual Report Download - page 39
Download and view the complete annual report
Please find page 39 of the 2005 PNC Bank annual report below. You can navigate through the pages in the report by either clicking on the pages listed below, or by using the keyword search tool below to find specific information within the annual report.-
 1
1 -
2
-
3
-
4
-
5
-
6
-
7
-
8
-
9
-
10
-
11
-
12
-
13
-
14
-
15
-
16
-
17
-
18
-
19
-
20
-
21
-
22
-
23
-
24
-
25
-
26
-
27
-
28
-
 29
29 -
 30
30 -
 31
31 -
 32
32 -
 33
33 -
 34
34 -
 35
35 -
 36
36 -
 37
37 -
 38
38 -
 39
39 -
 40
40 -
 41
41 -
 42
42 -
 43
43 -
 44
44 -
 45
45 -
 46
46 -
 47
47 -
 48
48 -
 49
49 -
50
-
51
-
52
-
53
-
54
-
55
-
56
-
57
-
58
-
59
-
60
-
61
-
62
-
63
-
64
-
65
-
66
-
67
-
68
-
69
-
70
-
71
-
72
-
73
-
74
-
75
-
76
-
77
-
78
-
79
-
80
-
81
-
82
-
83
-
84
-
85
-
86
-
87
-
88
-
89
-
90
-
91
-
92
-
93
-
94
-
95
-
96
-
97
-
98
-
99
-
100
-
101
-
102
-
103
-
104
-
105
-
106
-
107
-
108
-
109
-
110
-
111
-
112
-
113
-
114
-
115
-
116
-
117
-
118
-
119
-
120
-
121
-
122
-
123
-
124
-
125
-
126
-
127
-
128
-
129
-
130
-
131
-
132
-
133
-
134
-
135
-
136
-
137
-
138
-
139
-
140
-
141
-
142
-
143
-
144
-
145
-
146
-
147
-
148
-
149
-
150
-
151
-
152
-
153
-
154
-
155
-
156
-
157
-
158
-
159
-
160
-
161
-
162
-
163
-
164
-
165
-
166
-
167
-
168
-
169
-
170
-
171
-
172
-
173
-
174
-
175
-
176
-
177
-
178
-
179
-
180
-
181
-
182
-
183
-
184
-
185
-
186
-
187
-
188
-
189
-
190
-
191
-
192
-
193
-
194
-
195
-
196
-
197
-
198
-
199
-
200
-
201
-
202
-
203
-
204
-
205
-
206
-
207
-
208
-
209
-
210
-
211
-
212
-
213
-
214
-
215
-
216
-
217
-
218
-
219
-
220
-
221
-
222
-
223
-
224
-
225
-
226
-
227
-
228
-
229
-
230
-
231
-
232
-
233
-
234
-
235
-
236
-
237
-
238
-
239
-
240
-
241
-
242
-
243
-
244
-
245
-
246
-
247
-
248
-
249
-
250
-
251
-
252
-
253
-
254
-
255
-
256
-
257
-
258
-
259
-
260
-
261
-
262
-
263
-
264
-
265
-
266
-
267
-
268
-
269
-
270
-
271
-
272
-
273
-
274
-
275
-
276
-
277
-
278
-
279
-
280
-
281
-
282
-
283
-
284
-
285
-
286
-
287
-
288
-
289
-
290
-
291
-
292
-
293
-
294
-
295
-
296
-
297
-
298
-
299
-
300
 |
 |

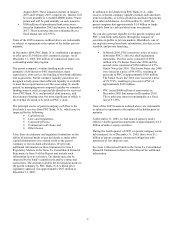
39
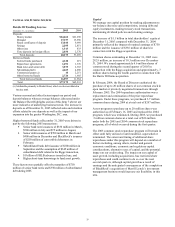
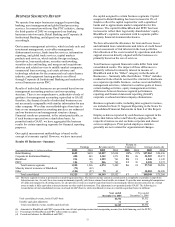
BLACKROCK
Year ended December 31
Taxable-equivalent basis
Dollars in millions except as noted 2005 2004
INCOME STATEMENT
Investment advisory and administrative fees $1,018 $633
Other income 173 92
Total operating revenue 1,191 725
Operating expense 748 423
Operating expense - LTIP 59 104
Fund administration and servicing costs 43 32
Total expense 850 559
Operating income 341 166
Nonoperating income 38 36
Pretax earnings 379 202
Minority interest 3 5
Income taxes 142 54
Earnings $234 $143
PERIOD-END BALANCE SHEET
Goodwill and other intangible assets $484 $184
Other assets 1,364 961
Total assets $1,848 $1,145
Liabilities and minority interest $926 $377
Stockholders’ equity 922 768
Total liabilities and stockholders’ equity $1,848 $1,145
PERFORMANCE DATA
Return on average equity 28% 19%
Operating margin 29 23
Diluted earnings per share $3.50 $2.17
ASSETS UNDER MANAGEMENT (in billions) (a)
Separate accounts
Fixed income $280 $216
Cash management 7 7
Cash management-securities lending 5 7
Equity 21 10
Alternative investment products 25 8
Total separate accounts 338 248
Mutual funds (b)
Fixed income 25 25
Cash management 74 64
Equity 16 5
Total mutual funds 115 94
Total assets under management $453 $342
OTHER INFORMATION
Full-time employees (a) 2,151 1,142
(a) At December 31.
(b) Includes BlackRock Funds, BlackRock Liquidity Funds, BlackRock Closed End
Funds, Short Term Investment Fund and BlackRock Global Series Funds.
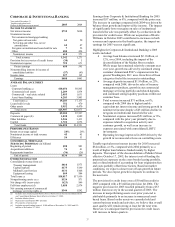
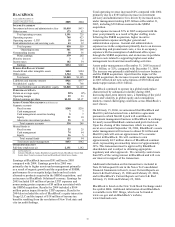
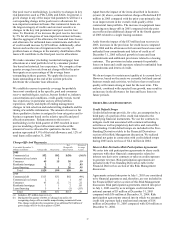
Earnings at BlackRock increased $91 million in 2005
compared with 2004. Earnings growth in 2005 was
primarily due to higher assets under management primarily
as a result of organic growth and the acquisition of SSRM;
performance fees on equity hedge funds and real estate
alternative products acquired in the SSRM acquisition; and
an increase in BlackRock Solutions revenue. Earnings for
2005 included $59 million of pretax LTIP expenses and
nonrecurring pretax expenses of $9 million associated with
the SSRM acquisition. Results for 2004 included a $104
million pretax impact from the LTIP expenses. Results for
2004 also included the sale of BlackRock’ s equity interest in
Trepp LLC and the impact of $18 million of income tax
benefits resulting from the resolution of New York state and
city tax audit findings.
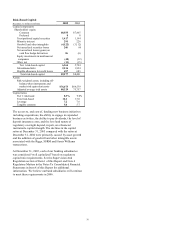
Total operating revenue increased 64% compared with 2004
primarily due to a $385 million increase in investment
advisory and administrative fees driven by increased assets
under management totaling $453 billion at December 31,
2005, including $50 billion assumed in the SSRM
acquisition.
Total expense increased 52% in 2005 compared with the
prior year primarily as a result of higher staffing levels
following the SSRM acquisition, higher incentive
compensation expense and higher general and
administration expense. General and administration
expense rose in the comparison primarily due to an increase
in marketing and promotional costs, a rise in occupancy
expense with the assumption of additional office space
through the SSRM acquisition, and an increase in portfolio
services costs related to supporting higher asset under
management levels and increased trading activities.
Assets under management at December 31, 2005 increased
$111 billion, or 32%, compared with December 31, 2004.
The increase was primarily attributable to net new business
and the SSRM acquisition. Apart from the impact of the
SSRM acquisition, the increase in assets under management
in 2005 reflected net new subscriptions of $50 billion and
market appreciation of $11 billion.
BlackRock continued to operate in a global marketplace
characterized by substantial volatility during 2005.
Increasing short-term interest rates, a flattening of the yield
curve and volatility in global equity and commodities
markets created challenging conditions across BlackRock’ s
asset classes.
On February 15, 2006, we announced that BlackRock and
Merrill Lynch had entered into a definitive agreement
pursuant to which Merrill Lynch will contribute its
investment management business to BlackRock in exchange
for newly issued BlackRock common and prefe rred stock.
Upon the closing of this transaction, which we expect to
occur on or around September 30, 2006, BlackRock’ s assets
under management will increase to almost $1 trillion and
Merrill Lynch will own an approximate 49% economic
interest in BlackRock. We will continue to own
approximately 44.5 million shares of BlackRock common
stock, representing an ownership interest of approximately
34%. This transaction must be approved by BlackRock
shareholders and is subject to obtaining appropriate
regulatory and other approvals. We currently control more
than 80% of the voting interest in BlackRock and will vote
our interest in support of the transaction.
Additional information on this transaction is included in
Note 26 Subsequent Event in the Notes To Consolidated
Financial Statements in Item 8, in our Current Reports on
Form 8-K filed February 15, 2006 and February 22, 2006,
and in BlackRock’ s Current Reports on Form 8-K filed
February 15, 2006 and February 22, 2006.
BlackRock is listed on the New York Stock Exchange under
the symbol BLK. Additional information about BlackRock
is available in its SEC filings, which can be found at
www.sec.gov and on BlackRock’ s website,
www.blackrock.com.