PNC Bank 2005 Annual Report Download - page 108
Download and view the complete annual report
Please find page 108 of the 2005 PNC Bank annual report below. You can navigate through the pages in the report by either clicking on the pages listed below, or by using the keyword search tool below to find specific information within the annual report.-
 1
1 -
2
-
3
-
4
-
5
-
6
-
7
-
8
-
9
-
10
-
11
-
12
-
13
-
14
-
15
-
16
-
17
-
18
-
19
-
20
-
21
-
22
-
23
-
24
-
25
-
26
-
27
-
28
-
29
-
30
-
31
-
32
-
33
-
34
-
35
-
36
-
37
-
38
-
39
-
40
-
41
-
42
-
43
-
44
-
45
-
46
-
47
-
48
-
49
-
50
-
51
-
52
-
53
-
54
-
55
-
56
-
57
-
58
-
59
-
60
-
61
-
62
-
63
-
64
-
65
-
66
-
67
-
68
-
69
-
70
-
71
-
72
-
73
-
74
-
75
-
76
-
77
-
78
-
79
-
80
-
81
-
82
-
83
-
84
-
85
-
86
-
87
-
88
-
89
-
90
-
91
-
92
-
93
-
94
-
95
-
96
-
97
-
 98
98 -
 99
99 -
 100
100 -
 101
101 -
 102
102 -
 103
103 -
 104
104 -
 105
105 -
 106
106 -
 107
107 -
 108
108 -
 109
109 -
 110
110 -
 111
111 -
 112
112 -
 113
113 -
 114
114 -
 115
115 -
 116
116 -
 117
117 -
 118
118 -
119
-
120
-
121
-
122
-
123
-
124
-
125
-
126
-
127
-
128
-
129
-
130
-
131
-
132
-
133
-
134
-
135
-
136
-
137
-
138
-
139
-
140
-
141
-
142
-
143
-
144
-
145
-
146
-
147
-
148
-
149
-
150
-
151
-
152
-
153
-
154
-
155
-
156
-
157
-
158
-
159
-
160
-
161
-
162
-
163
-
164
-
165
-
166
-
167
-
168
-
169
-
170
-
171
-
172
-
173
-
174
-
175
-
176
-
177
-
178
-
179
-
180
-
181
-
182
-
183
-
184
-
185
-
186
-
187
-
188
-
189
-
190
-
191
-
192
-
193
-
194
-
195
-
196
-
197
-
198
-
199
-
200
-
201
-
202
-
203
-
204
-
205
-
206
-
207
-
208
-
209
-
210
-
211
-
212
-
213
-
214
-
215
-
216
-
217
-
218
-
219
-
220
-
221
-
222
-
223
-
224
-
225
-
226
-
227
-
228
-
229
-
230
-
231
-
232
-
233
-
234
-
235
-
236
-
237
-
238
-
239
-
240
-
241
-
242
-
243
-
244
-
245
-
246
-
247
-
248
-
249
-
250
-
251
-
252
-
253
-
254
-
255
-
256
-
257
-
258
-
259
-
260
-
261
-
262
-
263
-
264
-
265
-
266
-
267
-
268
-
269
-
270
-
271
-
272
-
273
-
274
-
275
-
276
-
277
-
278
-
279
-
280
-
281
-
282
-
283
-
284
-
285
-
286
-
287
-
288
-
289
-
290
-
291
-
292
-
293
-
294
-
295
-
296
-
297
-
298
-
299
-
300
 |
 |

108
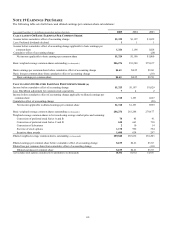
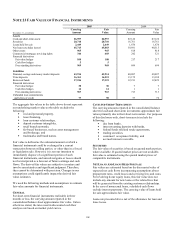
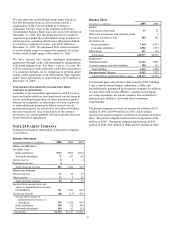
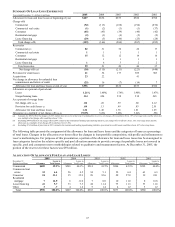
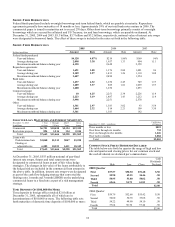
NOTE 23 FAIR VALUE OF FINANCIAL INSTRUMENTS
2005 2004
December 31 - in millions
Carrying
Amount
Fair
Value
Carrying
Amount
Fair
Value
Assets
Cash and short-term assets $6,957 $6,957 $7,126 $7,126
Securities 20,710 20,710 16,761 16,761
Loans held for sale 2,449 2,449 1,670 1,670
Net loans (excludes leases) 45,713 45,883 39,691 40,315
Other assets 965 965 818 818
Commercial mortgage servicing rights 344 403 242 321
Financial derivatives
Fair value hedges 108 108 217 217
Cash flow hedges 5 5
Free-standing derivatives 969 969 699 699
Liabilities
Demand, savings and money market deposits 43,914 43,914 40,097 40,097
Time deposits 16,361 16,215 13,172 13,188
Borrowed funds 17,186 17,323 12,211 12,429
Financial derivatives
Fair value hedges 30 30 7 7
Cash flow hedges 14 14 1 1
Free-standing derivatives 967 967 713 713
Unfunded loan commitments
and letters of credit 77 98 57 76
The aggregate fair values in the table above do not represent
our underlying market value as the table excludes the
following:
• real and personal property,
• lease financing,
• loan customer relationships,
• deposit customer intangibles,
• retail branch networks,
• fee-based businesses, such as asset management
and brokerage, and
• trademarks and brand names.
Fair value is defined as the estimated amount at which a
financial instrument could be exchanged in a current
transaction between willing parties, or other than in a forced
or liquidation sale. However, it is not our intention to
immediately dispose of a significant portion of such
financial instruments, and unrealized gains or losses should
not be interpreted as a forecast of future earnings and cash
flows. The derived fair values are subjective in nature and
involve uncertainties and significant judgment. Therefore,
they cannot be determined with precision. Changes in our
assumptions could significantly impact the derived fair
value estimates.
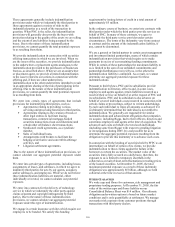
We used the following methods and assumptions to estimate
fair value amounts for financial instruments.
GENERAL
For short-term financial instruments realizable in three
months or less, the carrying amount reported in the
consolidated balance sheet approximates fair value. Unless
otherwise stated, the rates used in discounted cash flow
analyses are based on market yield curves.
CASH AND SHORT-TERM ASSETS
The carrying amounts reported in the consolidated balance
sheet for cash and short-term investments approximate fair
values primarily due to their short-term nature. For purposes
of this disclosure only, short-term assets include the
following:
• due from banks,
• interest-earning deposits with banks,
• federal funds sold and resale agreements,
• trading securities,
• customers’ acceptance liability, and
• accrued interest receivable.
SECURITIES
The fair value of securities is based on quoted market prices,
where available. If quoted market prices are not available,
fair value is estimated using the quoted market prices of
comparable instruments.
NET LOANS AND LOANS HELD FOR SALE
Fair values are estimated based on the discounted value of
expected net cash flows incorporating assumptions about
prepayment rates, credit losses and servicing fees and costs.
For revolving home equity loans, this fair value does not
include any amount for new loans or the related fees that
will be generated from the existing customer relationships.
In the case of nonaccrual loans, scheduled cash flows
exclude interest payments. The carrying value of loans held
for sale approximates fair value.
Loans are presented above net of the allowance for loan and
lease losses.