PNC Bank 2005 Annual Report Download - page 25
Download and view the complete annual report
Please find page 25 of the 2005 PNC Bank annual report below. You can navigate through the pages in the report by either clicking on the pages listed below, or by using the keyword search tool below to find specific information within the annual report.-
 1
1 -
2
-
3
-
4
-
5
-
6
-
7
-
8
-
9
-
10
-
11
-
12
-
13
-
14
-
 15
15 -
 16
16 -
 17
17 -
 18
18 -
 19
19 -
 20
20 -
 21
21 -
 22
22 -
 23
23 -
 24
24 -
 25
25 -
 26
26 -
 27
27 -
 28
28 -
 29
29 -
 30
30 -
 31
31 -
 32
32 -
 33
33 -
 34
34 -
 35
35 -
36
-
37
-
38
-
39
-
40
-
41
-
42
-
43
-
44
-
45
-
46
-
47
-
48
-
49
-
50
-
51
-
52
-
53
-
54
-
55
-
56
-
57
-
58
-
59
-
60
-
61
-
62
-
63
-
64
-
65
-
66
-
67
-
68
-
69
-
70
-
71
-
72
-
73
-
74
-
75
-
76
-
77
-
78
-
79
-
80
-
81
-
82
-
83
-
84
-
85
-
86
-
87
-
88
-
89
-
90
-
91
-
92
-
93
-
94
-
95
-
96
-
97
-
98
-
99
-
100
-
101
-
102
-
103
-
104
-
105
-
106
-
107
-
108
-
109
-
110
-
111
-
112
-
113
-
114
-
115
-
116
-
117
-
118
-
119
-
120
-
121
-
122
-
123
-
124
-
125
-
126
-
127
-
128
-
129
-
130
-
131
-
132
-
133
-
134
-
135
-
136
-
137
-
138
-
139
-
140
-
141
-
142
-
143
-
144
-
145
-
146
-
147
-
148
-
149
-
150
-
151
-
152
-
153
-
154
-
155
-
156
-
157
-
158
-
159
-
160
-
161
-
162
-
163
-
164
-
165
-
166
-
167
-
168
-
169
-
170
-
171
-
172
-
173
-
174
-
175
-
176
-
177
-
178
-
179
-
180
-
181
-
182
-
183
-
184
-
185
-
186
-
187
-
188
-
189
-
190
-
191
-
192
-
193
-
194
-
195
-
196
-
197
-
198
-
199
-
200
-
201
-
202
-
203
-
204
-
205
-
206
-
207
-
208
-
209
-
210
-
211
-
212
-
213
-
214
-
215
-
216
-
217
-
218
-
219
-
220
-
221
-
222
-
223
-
224
-
225
-
226
-
227
-
228
-
229
-
230
-
231
-
232
-
233
-
234
-
235
-
236
-
237
-
238
-
239
-
240
-
241
-
242
-
243
-
244
-
245
-
246
-
247
-
248
-
249
-
250
-
251
-
252
-
253
-
254
-
255
-
256
-
257
-
258
-
259
-
260
-
261
-
262
-
263
-
264
-
265
-
266
-
267
-
268
-
269
-
270
-
271
-
272
-
273
-
274
-
275
-
276
-
277
-
278
-
279
-
280
-
281
-
282
-
283
-
284
-
285
-
286
-
287
-
288
-
289
-
290
-
291
-
292
-
293
-
294
-
295
-
296
-
297
-
298
-
299
-
300
 |
 |
25
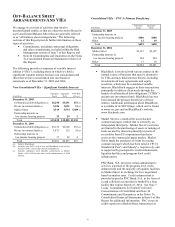
2004. The 21% revenue growth was primarily driven by
growth in the commercial mortgage servicing portfolio and
related services.
Revenue from equipment leasing products was $69 million
for 2005 and $84 million for 2004. The decline was
primarily due to the interest cost of funding the potential tax
exposure on the cross-border leasing portfolio. The impact
of cross-border leasing is expected to continue to have a
negative impact on leasing revenue in 2006. See Cross-
Border Leases and Related Tax and Accounting Matters in
the Consolidated Balance Sheet Review section of this Item
7 for further information.
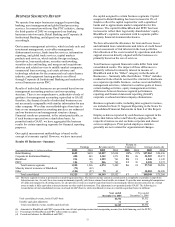
As a component of our advisory services to clients, we
provide a select set of insurance products to fulfill specific
customer financial needs. Primary insurance offerings
include:
• Annuities,
• Life,
• Credit life,
• Health,
• Disability, and
• Commercial lines coverage.
Client segments served by these insurance solutions include
those in Retail Banking and Corporate & Institutional
Banking. Insurance products are sold by PNC-licensed
insurance agents and through licensed third-party
arrangements. We recognized revenue from these products
of $61 million in 2005 and $65 million in 2004. The
decrease reflected a decline in annuity fee revenue driven
primarily by the sale of our modified coinsurance contracts
in 2004.
PNC, through subsidiary companies, Alpine Indemnity
Limited and PNC Insurance Corp., participates as a
reinsurer for its general liability, automobile liability and
workers’ compensation programs and as a direct writer for
its property and certified domestic terrorism programs.
In the normal course of business, PNC Insurance Corp. and
Alpine Indemnity Limited maintain insurance reserves for
reported claims and for claims incurred but not reported
based on actuarial assessments. We believe these reserves
were adequate at December 31, 2005.
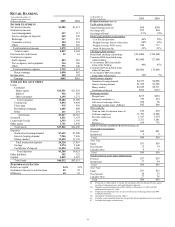
NONINTEREST EXPENSE
Total noninterest expense was $4.333 billion for 2005, an
increase of $598 million compared with 2004. The
efficiency ratio was 69% for 2005 and 68% for 2004.
We expect noninterest expense to be flat in 2006 compared
with 2005 except for the increase in our ownership in the
Merchant Services business and the impact of the Harris
Williams acquisition.
Noninterest expense for 2005 included the following:
• An increase of $325 million in BlackRock non-
LTIP operating expenses that reflected the impact
of costs resulting from the first quarter 2005 SSRM
acquisition and other investments to fund growth;
• Costs totaling approximately $132 million resulting
from our Riggs acquisition, including
approximately $16 million of integration costs;
• BlackRock LTIP charges of $64 million;
• Implementation costs totaling $53 million related
to the One PNC initiative;
• Contributions of BlackRock stock to the PNC
Foundation of $40 million; and
• Costs totaling $17 million related to the Harris
Williams acquisition.
The effect of these increases was partially offset by cost
reductions of approximately $90 million realized in 2005
from the One PNC initiative. The impact of the Riggs
integration and One PNC implementation costs was
reflected in several noninterest expense items in the
Consolidated Income Statement.
Noninterest expense for 2004 included a $110 million
charge associated with the BlackRock LTIP and conversion-
related and other nonrecurring costs totaling approximately
$11 million related to our acquisition of United National
Bancorp, Inc.
Apart from the impact of these items, noninterest expense
increased $178 million, or 5%, in 2005 compared with
2004. These higher expenses were driven by investments in
our businesses and increased sales incentives.
EFFECTIVE TAX RATE
Our effective tax rate was 30.8% for both 2005 and 2004.
Several factors contributed to a relatively low effective tax
rate for each year.
The low effective rate for 2005 was primarily attributable to
the impact of the reversal of deferred tax liabilities in
connection with the transfer of our ownership in BlackRock
to our intermediate bank holding company. This transaction
reduced our first quarter 2005 tax provision by $45 million,
or $.16 per diluted share. See Note 2 Acquisitions in the
Notes To Consolidated Financial Statements in Item 8 of
this Report for additional information.
The following favorably impacted the effective tax rate for
2004:
• A reduced state and local tax expense due to tax
benefits of $18 million recorded in connection with
New York state and city audit findings, primarily
associated with BlackRock, and
• A $14 million reduction in income tax expense
following our determination that we no longer
required an income tax reserve related to bank-
owned life insurance.
We expect the effective tax rate in 2006 to be closer to the
statutory tax rate.