PNC Bank 2005 Annual Report Download - page 106
Download and view the complete annual report
Please find page 106 of the 2005 PNC Bank annual report below. You can navigate through the pages in the report by either clicking on the pages listed below, or by using the keyword search tool below to find specific information within the annual report.-
 1
1 -
2
-
3
-
4
-
5
-
6
-
7
-
8
-
9
-
10
-
11
-
12
-
13
-
14
-
15
-
16
-
17
-
18
-
19
-
20
-
21
-
22
-
23
-
24
-
25
-
26
-
27
-
28
-
29
-
30
-
31
-
32
-
33
-
34
-
35
-
36
-
37
-
38
-
39
-
40
-
41
-
42
-
43
-
44
-
45
-
46
-
47
-
48
-
49
-
50
-
51
-
52
-
53
-
54
-
55
-
56
-
57
-
58
-
59
-
60
-
61
-
62
-
63
-
64
-
65
-
66
-
67
-
68
-
69
-
70
-
71
-
72
-
73
-
74
-
75
-
76
-
77
-
78
-
79
-
80
-
81
-
82
-
83
-
84
-
85
-
86
-
87
-
88
-
89
-
90
-
91
-
92
-
93
-
94
-
95
-
 96
96 -
 97
97 -
 98
98 -
 99
99 -
 100
100 -
 101
101 -
 102
102 -
 103
103 -
 104
104 -
 105
105 -
 106
106 -
 107
107 -
 108
108 -
 109
109 -
 110
110 -
 111
111 -
 112
112 -
 113
113 -
 114
114 -
 115
115 -
 116
116 -
117
-
118
-
119
-
120
-
121
-
122
-
123
-
124
-
125
-
126
-
127
-
128
-
129
-
130
-
131
-
132
-
133
-
134
-
135
-
136
-
137
-
138
-
139
-
140
-
141
-
142
-
143
-
144
-
145
-
146
-
147
-
148
-
149
-
150
-
151
-
152
-
153
-
154
-
155
-
156
-
157
-
158
-
159
-
160
-
161
-
162
-
163
-
164
-
165
-
166
-
167
-
168
-
169
-
170
-
171
-
172
-
173
-
174
-
175
-
176
-
177
-
178
-
179
-
180
-
181
-
182
-
183
-
184
-
185
-
186
-
187
-
188
-
189
-
190
-
191
-
192
-
193
-
194
-
195
-
196
-
197
-
198
-
199
-
200
-
201
-
202
-
203
-
204
-
205
-
206
-
207
-
208
-
209
-
210
-
211
-
212
-
213
-
214
-
215
-
216
-
217
-
218
-
219
-
220
-
221
-
222
-
223
-
224
-
225
-
226
-
227
-
228
-
229
-
230
-
231
-
232
-
233
-
234
-
235
-
236
-
237
-
238
-
239
-
240
-
241
-
242
-
243
-
244
-
245
-
246
-
247
-
248
-
249
-
250
-
251
-
252
-
253
-
254
-
255
-
256
-
257
-
258
-
259
-
260
-
261
-
262
-
263
-
264
-
265
-
266
-
267
-
268
-
269
-
270
-
271
-
272
-
273
-
274
-
275
-
276
-
277
-
278
-
279
-
280
-
281
-
282
-
283
-
284
-
285
-
286
-
287
-
288
-
289
-
290
-
291
-
292
-
293
-
294
-
295
-
296
-
297
-
298
-
299
-
300
 |
 |

106
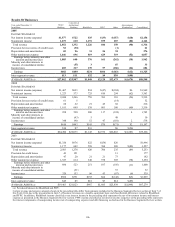
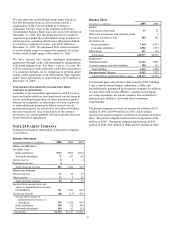
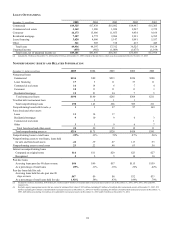
Results Of Businesses
Year ended December 31
In millions
Retail
Banking
Corporate &
Institutional
Banking
BlackRock
PFPC
Other
Intercompany
Eliminations Consolidated
2005
INCOME STATEMENT
Net interest income (expense) $1,577
$722 $35 $(33)
$(137)
$(10) $2,154
Noninterest income 1,275
610 1,191 879 287 (80) 4,162
Total revenue 2,852
1,332 1,226 846 150 (90) 6,316
Provision for (recoveries of) credit losses 52
(30) (1)
21
Depreciation and amortization 69
26 31 56 94 276
Other noninterest expense 1,646
696 819 629 319 (52) 4,057
Earnings before minority and other
interests and income taxes 1,085
640 376 161 (262)
(38) 1,962
Minority and other interests in
income of consolidated entities
(57) 3 87 33
Income taxes 403
217 139 57 (186)
(26) 604
Earnings $682
$480 $234 $104 $(163)
$(12) $1,325
Inter-segment revenue $13
$11 $32 $4 $30 $(90)
AVERAGE ASSETS (a) $27,862
$25,907 $1,848 $2,128 $32,473 $(1,670) $88,548
2004
INCOME STATEMENT
Net interest income (expense) $1,467
$693 $34 $(47)
$(184)
$6 $1,969
Noninterest income 1,223
573 725 810 294 (62) 3,563
Total revenue 2,690
1,266 759 763 110 (56) 5,532
Provision for (recoveries of) credit losses 61
5 (14)
52
Depreciation and amortization 60
22 21 45 68 216
Other noninterest expense 1,611
649 538 601 180 (60) 3,519
Earnings before minority and other
interests and income taxes 958
590 200 117 (124)
4 1,745
Minority and other interests in
income of consolidated entities
(43) 5 48 10
Income taxes 348
190 52 47 (101)
2 538
Earnings $610
$443 $143 $70 $(71)
$2 $1,197
Inter-segment revenue $10
$7 $33 $6 $(56)
AVERAGE ASSETS (a) $24,496
$22,073 $1,145 $2,572 $26,863 $(1,883) $75,266
2003
INCOME STATEMENT
Net interest income (expense) $1,326
$676 $22 $(54)
$26 $1,996
Noninterest income 1,177
602 598 760 209 $(89) 3,257
Total revenue 2,503
1,278 620 706 235 (89) 5,253
Provision for credit losses 43
121 13 177
Depreciation and amortization 47
20 21 21 73 182
Other noninterest expense 1,527
614 348 578 305 (78) 3,294
Earnings before minority and other
interests and income taxes 886
523 251 107 (156)
(11) 1,600
Minority and other interests in
income of consolidated entities (21) 53 32
Income taxes 320
153 96 43 (67)
(6) 539
Earnings $566
$391 $155 $64 $(142)
$(5) $1,029
Inter-segment revenue $45
$5 $18 $7 $14 $(89)
AVERAGE ASSETS (a) $19,463
$21,023 $967 $1,885 $25,839 $(1,898) $67,279
(a) Period-end balances for BlackRock and PFPC.
Certain revenue and expense amounts shown in the preceding table differ from amounts included in the Business Segments Review section of Item 7 of
this Form 10-K due to the presentation in Item 7 of business revenues on a taxable-equivalent basis and classification differences related to BlackRock
and PFPC. In addition, BlackRock income classified as net interest income in the preceding table represents the net of investment income and interest
expense as presented in the Business Segments Review section. PFPC income classified as net interest income (expense) in the preceding table represents
the interest components of nonoperating income (net of nonoperating expense) and debt financing as disclosed in the Business Segments Review section.