PNC Bank 2005 Annual Report Download - page 24
Download and view the complete annual report
Please find page 24 of the 2005 PNC Bank annual report below. You can navigate through the pages in the report by either clicking on the pages listed below, or by using the keyword search tool below to find specific information within the annual report.-
 1
1 -
2
-
3
-
4
-
5
-
6
-
7
-
8
-
9
-
10
-
11
-
12
-
13
-
 14
14 -
 15
15 -
 16
16 -
 17
17 -
 18
18 -
 19
19 -
 20
20 -
 21
21 -
 22
22 -
 23
23 -
 24
24 -
 25
25 -
 26
26 -
 27
27 -
 28
28 -
 29
29 -
 30
30 -
 31
31 -
 32
32 -
 33
33 -
 34
34 -
35
-
36
-
37
-
38
-
39
-
40
-
41
-
42
-
43
-
44
-
45
-
46
-
47
-
48
-
49
-
50
-
51
-
52
-
53
-
54
-
55
-
56
-
57
-
58
-
59
-
60
-
61
-
62
-
63
-
64
-
65
-
66
-
67
-
68
-
69
-
70
-
71
-
72
-
73
-
74
-
75
-
76
-
77
-
78
-
79
-
80
-
81
-
82
-
83
-
84
-
85
-
86
-
87
-
88
-
89
-
90
-
91
-
92
-
93
-
94
-
95
-
96
-
97
-
98
-
99
-
100
-
101
-
102
-
103
-
104
-
105
-
106
-
107
-
108
-
109
-
110
-
111
-
112
-
113
-
114
-
115
-
116
-
117
-
118
-
119
-
120
-
121
-
122
-
123
-
124
-
125
-
126
-
127
-
128
-
129
-
130
-
131
-
132
-
133
-
134
-
135
-
136
-
137
-
138
-
139
-
140
-
141
-
142
-
143
-
144
-
145
-
146
-
147
-
148
-
149
-
150
-
151
-
152
-
153
-
154
-
155
-
156
-
157
-
158
-
159
-
160
-
161
-
162
-
163
-
164
-
165
-
166
-
167
-
168
-
169
-
170
-
171
-
172
-
173
-
174
-
175
-
176
-
177
-
178
-
179
-
180
-
181
-
182
-
183
-
184
-
185
-
186
-
187
-
188
-
189
-
190
-
191
-
192
-
193
-
194
-
195
-
196
-
197
-
198
-
199
-
200
-
201
-
202
-
203
-
204
-
205
-
206
-
207
-
208
-
209
-
210
-
211
-
212
-
213
-
214
-
215
-
216
-
217
-
218
-
219
-
220
-
221
-
222
-
223
-
224
-
225
-
226
-
227
-
228
-
229
-
230
-
231
-
232
-
233
-
234
-
235
-
236
-
237
-
238
-
239
-
240
-
241
-
242
-
243
-
244
-
245
-
246
-
247
-
248
-
249
-
250
-
251
-
252
-
253
-
254
-
255
-
256
-
257
-
258
-
259
-
260
-
261
-
262
-
263
-
264
-
265
-
266
-
267
-
268
-
269
-
270
-
271
-
272
-
273
-
274
-
275
-
276
-
277
-
278
-
279
-
280
-
281
-
282
-
283
-
284
-
285
-
286
-
287
-
288
-
289
-
290
-
291
-
292
-
293
-
294
-
295
-
296
-
297
-
298
-
299
-
300
 |
 |
24
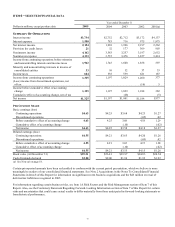
fees at BlackRock, and other growth in assets managed and
serviced.
Assets under management at December 31, 2005 totaled
$494 billion compared with $383 billion at December 31,
2004. In addition to the impact of net new business during
2005, the acquisition of SSRM added $50 billion of assets
under management during the first quarter of 2005. PFPC
provided fund accounting/administration services for $830
billion of net fund assets and provided custody services for
$476 billion of fund assets at December 31, 2005, compared
with $721 billion and $451 billion, respectively, at
December 31, 2004. These increases were driven by net new
business and asset inflows from existing customers, as well
as comparatively favorable market conditions.
Service charges on deposits increased $21 million for 2005
compared with 2004. Although growth in service charges
has been limited due to our offering of free checking in both
the consumer and small business channels, free checking
has positively impacted customer and demand deposit
growth as well as other deposit-related fees.
Brokerage fees increased $6 million, to $225 million, for
2005 compared with the prior year. The increase was
primarily due to higher mutual fund-related revenues in
2005.
Consumer services fees increased $23 million, to $287
million, in 2005 compared with 2004. Higher fees reflected
additional fees from debit card transactions, primarily due to
higher volumes and the expansion into the greater
Washington, D.C. area.
Corporate services revenue was $511 million for 2005,
compared with $493 million in 2004. Corporate services
revenue in 2005 benefited from the impact of higher net
gains on commercial mortgage loan sales, higher fees
related to commercial mortgage servicing activities,
increased loan syndication fees and higher capital markets
revenues, including revenues attributable to Harris
Williams, compared with the prior year. These increases
were partially offset by a $45 million decline in 2005 of net
gains in excess of valuation adjustments related to our
liquidation of institutional loans held for sale. Our
liquidation of institutional loans held for sale is now
complete.
Equity management (private equity) net gains on portfolio
investments totaled $96 million for 2005 and $67 million
for 2004.
Net securities losses amounted to $41 million for 2005
compared with net securities gains of $55 million in 2004.
Our discussion under the Consolidated Balance Sheet
Review section of this Item 7 provides additional
information on the impact on net securities losses of actions
taken during the second quarter of 2005 regarding our
securities portfolio.
Noninterest revenue from trading activities totaled $157
million for 2005 and $113 million for 2004. While customer
activity represented the majority of trading revenue, the
increase compared with 2004 was primarily the result of
proprietary trading activities. We provide additional
information on our trading activities under Market Risk
Management – Trading Ris k in the Risk Management
section of this Item 7.
Other noninterest income increased $52 million, to $341
million, in 2005 compared with 2004. Other noninterest
income typically fluctuates from period to period depending
on the nature and magnitude of transactions completed.
Other noninterest income for 2005 included the following
pretax items:
• A $33 million gain related to contributions of
BlackRock stock to the PNC Foundation,
transactions that also impacted noninterest
expense, and
• Income related to the 2005 SSRM and Riggs
acquisitions.
These factors more than offset the impact of the following
pretax gains in 2004:
• A first quarter $34 million gain related to the sale
of our modified coinsurance contracts, and
• A second quarter $13 million gain recognized in
connection with BlackRock’ s sale of its interest in
Trepp LLC, a provider of commercial mortgage-
backed security information, analytics and
technology.
PRODUCT REVENUE
Corporate & Institutional Banking offers treasury
management and capital markets-related products and
services, commercial loan servicing and equipment leasing
products that are marketed by several businesses across
PNC.
Treasury management revenue, which includes fees as well
as net interest revenue from customer deposit balances,
totaled $410 million for 2005 and $373 million for 2004.
The 10% increase in revenue reflected the longer-term
nature of treasury management deposits along with the
rising interest rate environment, strong deposit growth,
continued expansion and client utilization of commercial
card services, and a steady increase in business-to-business
processing volumes. The acquisition of Riggs also
contributed to the revenue growth in 2005.
Revenue from capital markets products and services was
$175 million for 2005, compared with $140 million in 2004.
The acquisition of Harris Williams and increases in loan
syndication fees and other client-related activity drove the
25% increase in capital markets revenue.
Midland Loan Services offers servicing, real estate advis ory
and technology solutions for the commercial real estate
finance industry. Midland’ s revenue, which includes fees
and net interest income from servicing portfolio deposit
balances, totaled $131 million for 2005 and $108 million for