PNC Bank 2005 Annual Report Download - page 20
Download and view the complete annual report
Please find page 20 of the 2005 PNC Bank annual report below. You can navigate through the pages in the report by either clicking on the pages listed below, or by using the keyword search tool below to find specific information within the annual report.-
 1
1 -
2
-
3
-
4
-
5
-
6
-
7
-
8
-
9
-
 10
10 -
 11
11 -
 12
12 -
 13
13 -
 14
14 -
 15
15 -
 16
16 -
 17
17 -
 18
18 -
 19
19 -
 20
20 -
 21
21 -
 22
22 -
 23
23 -
 24
24 -
 25
25 -
 26
26 -
 27
27 -
 28
28 -
 29
29 -
 30
30 -
31
-
32
-
33
-
34
-
35
-
36
-
37
-
38
-
39
-
40
-
41
-
42
-
43
-
44
-
45
-
46
-
47
-
48
-
49
-
50
-
51
-
52
-
53
-
54
-
55
-
56
-
57
-
58
-
59
-
60
-
61
-
62
-
63
-
64
-
65
-
66
-
67
-
68
-
69
-
70
-
71
-
72
-
73
-
74
-
75
-
76
-
77
-
78
-
79
-
80
-
81
-
82
-
83
-
84
-
85
-
86
-
87
-
88
-
89
-
90
-
91
-
92
-
93
-
94
-
95
-
96
-
97
-
98
-
99
-
100
-
101
-
102
-
103
-
104
-
105
-
106
-
107
-
108
-
109
-
110
-
111
-
112
-
113
-
114
-
115
-
116
-
117
-
118
-
119
-
120
-
121
-
122
-
123
-
124
-
125
-
126
-
127
-
128
-
129
-
130
-
131
-
132
-
133
-
134
-
135
-
136
-
137
-
138
-
139
-
140
-
141
-
142
-
143
-
144
-
145
-
146
-
147
-
148
-
149
-
150
-
151
-
152
-
153
-
154
-
155
-
156
-
157
-
158
-
159
-
160
-
161
-
162
-
163
-
164
-
165
-
166
-
167
-
168
-
169
-
170
-
171
-
172
-
173
-
174
-
175
-
176
-
177
-
178
-
179
-
180
-
181
-
182
-
183
-
184
-
185
-
186
-
187
-
188
-
189
-
190
-
191
-
192
-
193
-
194
-
195
-
196
-
197
-
198
-
199
-
200
-
201
-
202
-
203
-
204
-
205
-
206
-
207
-
208
-
209
-
210
-
211
-
212
-
213
-
214
-
215
-
216
-
217
-
218
-
219
-
220
-
221
-
222
-
223
-
224
-
225
-
226
-
227
-
228
-
229
-
230
-
231
-
232
-
233
-
234
-
235
-
236
-
237
-
238
-
239
-
240
-
241
-
242
-
243
-
244
-
245
-
246
-
247
-
248
-
249
-
250
-
251
-
252
-
253
-
254
-
255
-
256
-
257
-
258
-
259
-
260
-
261
-
262
-
263
-
264
-
265
-
266
-
267
-
268
-
269
-
270
-
271
-
272
-
273
-
274
-
275
-
276
-
277
-
278
-
279
-
280
-
281
-
282
-
283
-
284
-
285
-
286
-
287
-
288
-
289
-
290
-
291
-
292
-
293
-
294
-
295
-
296
-
297
-
298
-
299
-
300
 |
 |

20
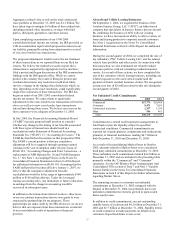
eliminated as of December 31, 2005. We estimate that these
changes will result in employee severance and other
implementation costs of approximately $74 million,
including $54 million recognized during the second half of
2005. We expect that the remaining charges will be
incurred in 2006 and early 2007. The initiatives
implemented to date have required approximately $11
million lower costs than originally expected, and we expect
to maintain that variance over the remainder of the One
PNC program. In addition, PNC intends to achieve at least
$100 million in net revenue growth through the
implementation of various pricing and business growth
enhancements driven by the One PNC initiative. Initiatives
to achieve this growth are progressing according to plan.
We realized a net pretax financial benefit from the One PNC
program of approximately $90 million in 2005, primarily in
the latter half of the year and primarily in our banking
businesses, which was $55 million more than we had
previously estimated. We achieved this benefit by
accelerating some of the 2006 initiatives into 2005. We
expect to capture approximately $265 million in value by
the end of 2006 as originally planned.
KEY FACTORS AFFECTING FINANCIAL PERFORMANCE
Our financial performance is substantially affected by
several external factors outside of our control, including:
• General economic conditions,
• Loan demand and utilization of credit
commitments,
• Interest rates, and the shape of the interest rate
yield curve,
• The performance of the capital markets, and
• Customer demand for other products and services.
In addition to changes in general economic conditions,
including the direction, timing and magnitude of movement
in interest rates and the performance of the capital markets,
our success in 2006 will depend, among other things, upon:
• Further success in the acquisition, growth and
retention of customers,
• Successful execution of the One PNC initiative,
• Revenue growth,
• A sustained focus on expense management and
improved efficiency,
• Maintaining strong overall asset quality, and
• Prudent risk and capital management.
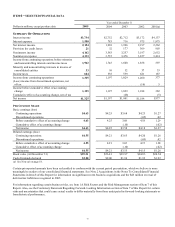
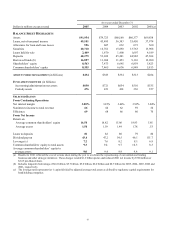
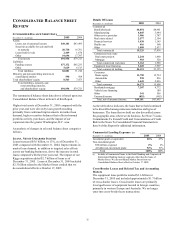
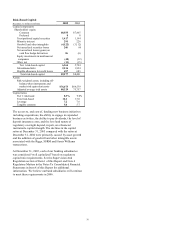
SUMMARY FINANCIAL RESULTS
Year ended December 31
In billions, except for
per share data 2005
2004
Net income $1.325 $1.197
Diluted earnings per share $4.55 $4.21
Return on
Average common
shareholders’ equity 16.58%
16.82%
Average assets 1.50% 1.59%
Results for 2005 included the impact of the following items:
• Implementation costs totaling $35 million after-tax,
or $.12 per diluted share, related to the One PNC
initiative;
• Integration costs of $20 million after-tax, or $.07
per diluted share, comprised of provision for credit
losses, noninterest expense and deferred taxes,
related to the May 2005 acquisition of Riggs;
• The reversal of deferred tax liabilities that
benefited earnings by $45 million, or $.16 per
diluted share, in the first quarter related to our
transfer of ownership in BlackRock from PNC
Bank, National Association (“PNC Bank, N.A.”) to
our intermediate bank holding company, PNC
Bancorp, Inc., in January 2005; and
• The $34 million after-tax benefit of a second
quarter 2005 loan recovery.
Results for 2004 reflected the impact of charges totaling $49
million after taxes, or $.17 per diluted share, related to the
2002 BlackRock Long-Term Retention and Incentive Plan
(“LTIP”). This LTIP is described under 2002 BlackRock
Long-Term Retention and Incentive Plan in Item 7 of this
Report.
Our performance in 2005 included the following
accomplishments:
• Total taxable-equivalent revenue for 2005
increased 14% compared with the prior year,
driven by continued growth in fee-based businesses
and net interest income.
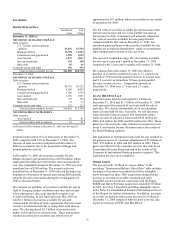
• Average deposits for the year increased $7.9
billion, or 16%, compared with 2004, driven by
higher money market deposits, certificates of
deposit and other time deposits as well as growth in
demand deposit balances, including the impact of
our expansion into the greater Washington, D.C.
area.
• Average loans for 2005 increased $6.4 billion, or
16%, compared with 2004, driven by consumer and
commercia l loan demand, as well as an increase in
residential mortgages, and the impact of our
expansion into the greater Washington, D.C. area.
• We have begun to realize benefits from the One
PNC initiative sooner than originally anticipated
and we remain on track to capture $400 million in
value from One PNC by 2007.
• PNC invested more than $1 billion in 2005 to build
scale and expand its presence into attractive
markets and products. These investments include:
expanding into the greater Washington, D.C. area
with our Riggs acquisition; BlackRock’ s
acquisition of SSRM to build scale; and the
addition of Harris Williams.
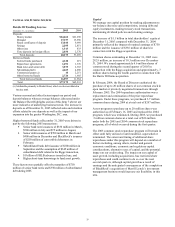
• Asset quality remained very strong. Although some
ratios increased, all remained at low levels. The
ratio of nonperforming assets to total loans, loans
held for sale and foreclosed assets was .42% at
December 31, 2005 compared with .39% at
December 31, 2004.