PNC Bank 2005 Annual Report Download - page 18
Download and view the complete annual report
Please find page 18 of the 2005 PNC Bank annual report below. You can navigate through the pages in the report by either clicking on the pages listed below, or by using the keyword search tool below to find specific information within the annual report.-
 1
1 -
2
-
3
-
4
-
5
-
6
-
7
-
 8
8 -
 9
9 -
 10
10 -
 11
11 -
 12
12 -
 13
13 -
 14
14 -
 15
15 -
 16
16 -
 17
17 -
 18
18 -
 19
19 -
 20
20 -
 21
21 -
 22
22 -
 23
23 -
 24
24 -
 25
25 -
 26
26 -
 27
27 -
 28
28 -
29
-
30
-
31
-
32
-
33
-
34
-
35
-
36
-
37
-
38
-
39
-
40
-
41
-
42
-
43
-
44
-
45
-
46
-
47
-
48
-
49
-
50
-
51
-
52
-
53
-
54
-
55
-
56
-
57
-
58
-
59
-
60
-
61
-
62
-
63
-
64
-
65
-
66
-
67
-
68
-
69
-
70
-
71
-
72
-
73
-
74
-
75
-
76
-
77
-
78
-
79
-
80
-
81
-
82
-
83
-
84
-
85
-
86
-
87
-
88
-
89
-
90
-
91
-
92
-
93
-
94
-
95
-
96
-
97
-
98
-
99
-
100
-
101
-
102
-
103
-
104
-
105
-
106
-
107
-
108
-
109
-
110
-
111
-
112
-
113
-
114
-
115
-
116
-
117
-
118
-
119
-
120
-
121
-
122
-
123
-
124
-
125
-
126
-
127
-
128
-
129
-
130
-
131
-
132
-
133
-
134
-
135
-
136
-
137
-
138
-
139
-
140
-
141
-
142
-
143
-
144
-
145
-
146
-
147
-
148
-
149
-
150
-
151
-
152
-
153
-
154
-
155
-
156
-
157
-
158
-
159
-
160
-
161
-
162
-
163
-
164
-
165
-
166
-
167
-
168
-
169
-
170
-
171
-
172
-
173
-
174
-
175
-
176
-
177
-
178
-
179
-
180
-
181
-
182
-
183
-
184
-
185
-
186
-
187
-
188
-
189
-
190
-
191
-
192
-
193
-
194
-
195
-
196
-
197
-
198
-
199
-
200
-
201
-
202
-
203
-
204
-
205
-
206
-
207
-
208
-
209
-
210
-
211
-
212
-
213
-
214
-
215
-
216
-
217
-
218
-
219
-
220
-
221
-
222
-
223
-
224
-
225
-
226
-
227
-
228
-
229
-
230
-
231
-
232
-
233
-
234
-
235
-
236
-
237
-
238
-
239
-
240
-
241
-
242
-
243
-
244
-
245
-
246
-
247
-
248
-
249
-
250
-
251
-
252
-
253
-
254
-
255
-
256
-
257
-
258
-
259
-
260
-
261
-
262
-
263
-
264
-
265
-
266
-
267
-
268
-
269
-
270
-
271
-
272
-
273
-
274
-
275
-
276
-
277
-
278
-
279
-
280
-
281
-
282
-
283
-
284
-
285
-
286
-
287
-
288
-
289
-
290
-
291
-
292
-
293
-
294
-
295
-
296
-
297
-
298
-
299
-
300
 |
 |

18
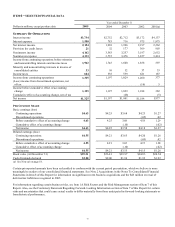
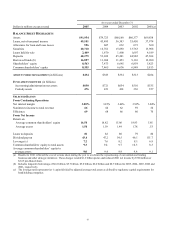
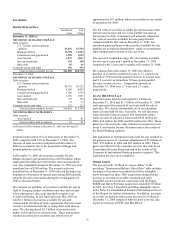
At or year ended December 31
Dollars in millions except as noted 2005 2004 2003 2002 2001(a)
BALANCE SHEET HIGHLIGHTS
Assets $91,954 $79,723 $68,168 $66,377 $69,638
Loans, net of unearned income 49,101 43,495 36,303 35,450 37,974
Allowance for loan and lease losses 596 607 632 673 560
Securities 20,710 16,761 15,690 13,763 13,908
Loans held for sale 2,449 1,670 1,400 1,607 4,189
Deposits 60,275 53,269 45,241 44,982 47,304
Borrowed funds (b) 16,897 11,964 11,453 9,116 12,090
Shareholders’ equity 8,563 7,473 6,645 6,859 5,823
Common shareholders’ equity 8,555 7,465 6,636 6,849 5,813
ASSETS UNDER MANAGEMENT (in billions) $494 $383 $354 $313 $284
FUND ASSETS SERVICED (in billions)
Accounting/administration net assets $830 $721 $654 $510 $535
Custody assets 476 451 401 336 357
SELECTED RATIOS
From Continuing Operations
Net interest margin 3.00%
3.22%
3.64%
3.99%
3.84%
Noninterest income to total revenue 66
64 62 59 54
Efficiency 69
68 66 60 70
From Net Income
Return on
Average common shareholders’ equity 16.58
16.82 15.06 18.83 5.65
Average assets 1.50
1.59 1.49 1.78 .53
Loans to deposits 81
82 80 79 80
Dividend payout 43.4
47.2 54.5 46.1 151.7
Leverage (c) 7.2
7.6 8.2 8.1 6.8
Common shareholders’ equity to total assets 9.3
9.4 9.7 10.3 8.3
Average common shareholders’ equity to
average assets 9.0
9.4 9.9
9.4
9.1
(a) Results for 2001 reflected the cost of actions taken during the year to accelerate the repositioning of our institutional lending
business and other strategic initiatives. These charges totaled $1.2 billion pretax and reduced 2001 net income by $768 million or
$2.65 per diluted share.
(b) Includes long-term borrowings of $6.8 billion, $5.7 billion, $5.8 billion, $6.0 billion and $8.7 billion for 2005, 2004, 2003, 2002 and
2001, respectively.
(c) The leverage ratio represents tier 1 capital divided by adjusted average total assets as defined by regulatory capital requirements for
bank holding companies.