PNC Bank 2005 Annual Report Download - page 73
Download and view the complete annual report
Please find page 73 of the 2005 PNC Bank annual report below. You can navigate through the pages in the report by either clicking on the pages listed below, or by using the keyword search tool below to find specific information within the annual report.-
 1
1 -
2
-
3
-
4
-
5
-
6
-
7
-
8
-
9
-
10
-
11
-
12
-
13
-
14
-
15
-
16
-
17
-
18
-
19
-
20
-
21
-
22
-
23
-
24
-
25
-
26
-
27
-
28
-
29
-
30
-
31
-
32
-
33
-
34
-
35
-
36
-
37
-
38
-
39
-
40
-
41
-
42
-
43
-
44
-
45
-
46
-
47
-
48
-
49
-
50
-
51
-
52
-
53
-
54
-
55
-
56
-
57
-
58
-
59
-
60
-
61
-
62
-
 63
63 -
 64
64 -
 65
65 -
 66
66 -
 67
67 -
 68
68 -
 69
69 -
 70
70 -
 71
71 -
 72
72 -
 73
73 -
 74
74 -
 75
75 -
 76
76 -
 77
77 -
 78
78 -
 79
79 -
 80
80 -
 81
81 -
 82
82 -
 83
83 -
84
-
85
-
86
-
87
-
88
-
89
-
90
-
91
-
92
-
93
-
94
-
95
-
96
-
97
-
98
-
99
-
100
-
101
-
102
-
103
-
104
-
105
-
106
-
107
-
108
-
109
-
110
-
111
-
112
-
113
-
114
-
115
-
116
-
117
-
118
-
119
-
120
-
121
-
122
-
123
-
124
-
125
-
126
-
127
-
128
-
129
-
130
-
131
-
132
-
133
-
134
-
135
-
136
-
137
-
138
-
139
-
140
-
141
-
142
-
143
-
144
-
145
-
146
-
147
-
148
-
149
-
150
-
151
-
152
-
153
-
154
-
155
-
156
-
157
-
158
-
159
-
160
-
161
-
162
-
163
-
164
-
165
-
166
-
167
-
168
-
169
-
170
-
171
-
172
-
173
-
174
-
175
-
176
-
177
-
178
-
179
-
180
-
181
-
182
-
183
-
184
-
185
-
186
-
187
-
188
-
189
-
190
-
191
-
192
-
193
-
194
-
195
-
196
-
197
-
198
-
199
-
200
-
201
-
202
-
203
-
204
-
205
-
206
-
207
-
208
-
209
-
210
-
211
-
212
-
213
-
214
-
215
-
216
-
217
-
218
-
219
-
220
-
221
-
222
-
223
-
224
-
225
-
226
-
227
-
228
-
229
-
230
-
231
-
232
-
233
-
234
-
235
-
236
-
237
-
238
-
239
-
240
-
241
-
242
-
243
-
244
-
245
-
246
-
247
-
248
-
249
-
250
-
251
-
252
-
253
-
254
-
255
-
256
-
257
-
258
-
259
-
260
-
261
-
262
-
263
-
264
-
265
-
266
-
267
-
268
-
269
-
270
-
271
-
272
-
273
-
274
-
275
-
276
-
277
-
278
-
279
-
280
-
281
-
282
-
283
-
284
-
285
-
286
-
287
-
288
-
289
-
290
-
291
-
292
-
293
-
294
-
295
-
296
-
297
-
298
-
299
-
300
 |
 |
73
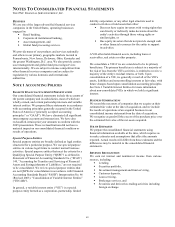
Specific allocations are made to significant impaired loans
and are determined in accordance with SFAS 114,
“Accounting by Creditors for Impairment of a Loan,” with
impairment measured generally based on the present value of
the loan’ s expected cash flows, the loan’ s observable market
price or the fair value of the loan’ s collateral. We establish a
specific allowance on all other impaired loans based on the
loan’ s loss given default credit risk rating.
Allocations to loan pools are developed by business segment
based on probability of default and loss given default risk
ratings by using historical loss trends and our judgment
concerning those trends and other relevant factors. These
factors may include, among others:
• Actual versus estimated losses,
• Regional and national economic conditions, and
• Business segment and portfolio concentrations.
Loss factors are based on industry and/or internal experience
and may be adjusted for significant factors that, based on our
judgment, impact the collectibility of the portfolio as of the
balance sheet date. Consumer and residential mortgage loan
allocations are made at a total portfolio level based on
historical loss experience adjusted for portfolio activity.
While our pool reserve methodologies strive to reflect all risk
factors, there continues to be a certain element of uncertainty
associated with, but not limited to, potential estimation errors
and imprecision in the estimation process due to the inherent
lag of information. We provide additional reserves that are
designed to provide coverage for expected losses attributable
to such risks. In addition, these incremental reserves also
include factors which may not be directly measured in the
determination of specific or pooled reserves. These factors
include:
• Industry concentration and conditions,
• Credit quality trends,
• Recent loss experience in particular segments of the
portfolio,
• Experience, ability and depth of lending
management,
• Changes in risk selection and underwriting
standards, and
• Bank regulatory considerations.
ALLOWANCE FOR UNFUNDED LOAN COMMITMENTS AND
LETTERS OF CREDIT
We maintain the allowance for unfunded loan commitments
and letters of credit at a level we believe is adequate to
absorb estimated probable losses related to these unfunded
credit facilities. We determine the adequacy of the allowance
based on periodic evaluations of the unfunded credit facilities
including an assessment of the probability of commitment
usage, credit risk factors for loans outstanding to these same
customers, and the terms and expiration dates of the
unfunded credit facilities. Net adjustments to the allowance
for unfunded loan commitments and letters of credit are
included in the provision for credit losses.
COMMERCIAL MORTGAGE SERVICING RIGHTS
We provide servicing under various commercial loan servicing
contracts. These contracts are either purchased in the market
place or retained as part of a commercial mortgage loan
securitization or loan sale. If a contract is purchased, it is
recorded at cost. If a contract is retained, the servicing right is
recorded based on its relative fair value to all of the assets
securitized or sold. Fair value is based on the present value of
the expected future cash flows, including assumptions as to:
• Interest rates for escrow and deposit balance earnings,
• Discount rates,
• Estimated prepayment speeds, and
• Estimated servicing costs.
We record the asset as an other intangible asset and amortize it
over its estimated life in proportion to estimated net servicing
income. On a quarterly basis, we test the asset for impairment.
If the estimated fair value of the asset is less than the carrying
value, an impairment loss is recognized. Servicing fees are
recognized as they are earned and are reported net of
amortization expense in noninterest income.
FAIR VALUE OF FINANCIAL INSTRUMENTS
The fair value of financial instruments and the methods and
assumptions used in estimating fair value amounts are detailed
in Note 23 Fair Value of Financial Instruments.
GOODWILL AND OTHER INTANGIBLE ASSETS
We test goodwill and indefinite-lived intangible assets for
impairment at least annually, or when events or changes in
circumstances indicate the assets might be impaired. Finite-
lived intangible assets are amortized to expense using
accelerated or straight-line methods over their respective
estimated useful lives. We review finite-lived intangible assets
for impairment when events or changes in circumstances
indicate that the asset’ s carrying amount is not recoverable
from undiscounted future cash flows or exceeds its fair value.
DEPRECIATION AND AMORTIZATION
For financial reporting purposes, we depreciate premises and
equipment principally using the straight-line method over their
estimated useful lives.
We use estimated useful lives for furniture and equipment
ranging from one to 10 years, and depreciate buildings over an
estimated useful life of up to 40 years. We amortize leasehold
improvements over their estimated useful lives of up to 15
years or the respective lease terms, whichever is shorter.
We purchase, as well as internally develop and customize,
certain software to enhance or perform internal business
functions. Software development costs incurred in the planning
and post-development project stages are charged to noninterest
expense. Costs associated with designing software
configuration and interfaces, installation, coding programs and
testing systems are capitalized and amortized using the
straight-line method over periods ranging from one to five
years.