PNC Bank 2005 Annual Report Download - page 86
Download and view the complete annual report
Please find page 86 of the 2005 PNC Bank annual report below. You can navigate through the pages in the report by either clicking on the pages listed below, or by using the keyword search tool below to find specific information within the annual report.-
 1
1 -
2
-
3
-
4
-
5
-
6
-
7
-
8
-
9
-
10
-
11
-
12
-
13
-
14
-
15
-
16
-
17
-
18
-
19
-
20
-
21
-
22
-
23
-
24
-
25
-
26
-
27
-
28
-
29
-
30
-
31
-
32
-
33
-
34
-
35
-
36
-
37
-
38
-
39
-
40
-
41
-
42
-
43
-
44
-
45
-
46
-
47
-
48
-
49
-
50
-
51
-
52
-
53
-
54
-
55
-
56
-
57
-
58
-
59
-
60
-
61
-
62
-
63
-
64
-
65
-
66
-
67
-
68
-
69
-
70
-
71
-
72
-
73
-
74
-
75
-
 76
76 -
 77
77 -
 78
78 -
 79
79 -
 80
80 -
 81
81 -
 82
82 -
 83
83 -
 84
84 -
 85
85 -
 86
86 -
 87
87 -
 88
88 -
 89
89 -
 90
90 -
 91
91 -
 92
92 -
 93
93 -
 94
94 -
 95
95 -
 96
96 -
97
-
98
-
99
-
100
-
101
-
102
-
103
-
104
-
105
-
106
-
107
-
108
-
109
-
110
-
111
-
112
-
113
-
114
-
115
-
116
-
117
-
118
-
119
-
120
-
121
-
122
-
123
-
124
-
125
-
126
-
127
-
128
-
129
-
130
-
131
-
132
-
133
-
134
-
135
-
136
-
137
-
138
-
139
-
140
-
141
-
142
-
143
-
144
-
145
-
146
-
147
-
148
-
149
-
150
-
151
-
152
-
153
-
154
-
155
-
156
-
157
-
158
-
159
-
160
-
161
-
162
-
163
-
164
-
165
-
166
-
167
-
168
-
169
-
170
-
171
-
172
-
173
-
174
-
175
-
176
-
177
-
178
-
179
-
180
-
181
-
182
-
183
-
184
-
185
-
186
-
187
-
188
-
189
-
190
-
191
-
192
-
193
-
194
-
195
-
196
-
197
-
198
-
199
-
200
-
201
-
202
-
203
-
204
-
205
-
206
-
207
-
208
-
209
-
210
-
211
-
212
-
213
-
214
-
215
-
216
-
217
-
218
-
219
-
220
-
221
-
222
-
223
-
224
-
225
-
226
-
227
-
228
-
229
-
230
-
231
-
232
-
233
-
234
-
235
-
236
-
237
-
238
-
239
-
240
-
241
-
242
-
243
-
244
-
245
-
246
-
247
-
248
-
249
-
250
-
251
-
252
-
253
-
254
-
255
-
256
-
257
-
258
-
259
-
260
-
261
-
262
-
263
-
264
-
265
-
266
-
267
-
268
-
269
-
270
-
271
-
272
-
273
-
274
-
275
-
276
-
277
-
278
-
279
-
280
-
281
-
282
-
283
-
284
-
285
-
286
-
287
-
288
-
289
-
290
-
291
-
292
-
293
-
294
-
295
-
296
-
297
-
298
-
299
-
300
 |
 |

86
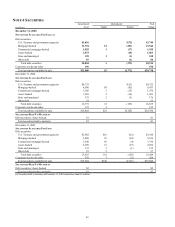
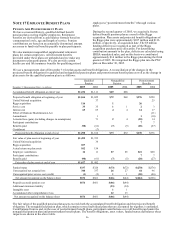
Information relating to securities sold is set forth in the
following table.
Securities Sold
Year ended
December 31
In millions Proceeds
Gross
Gains
Gross
Losses
Net
Gains
(Losses)
Tax
Expense
(Benefit)
2005 $13,304 $19 $60 $(41) $(14)
2004 14,206 94 39 55 19
2003 11,514 128 12 116 41
The carrying value of securities pledged to secure public and
trust deposits and repurchase agreements and for other
purposes was $10.8 billion at December 31, 2005 and $8.1
billion at December 31, 2004. The fair value of securities
accepted as collateral that we are permitted by contract or
custom to sell or repledge was $273 million at December 31,
2005 and is a component of federal funds sold and resale
agreements on our Consolidated Balance Sheet. All of this
amount was sold or repledged to others.
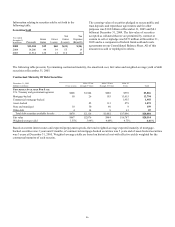
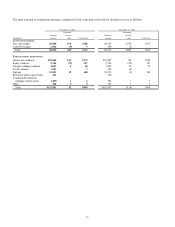
The following table presents, by remaining contractual maturity, the amortized cost, fair value and weighted-average yield of debt
securities at December 31, 2005.
Contractual Maturity Of Debt Securities
December 31, 2005
After 1 Year
After 5 Years
After 10
Dollars in millions 1 Year or Less through 5 Years through 10 Years Years Total
SECURITIES AVAILABLE FOR SALE
U.S. Treasury and government agencies $606 $1,944 $688 $578 $3,816
Mortgage-backed 50 26 103 13,615 13,794
Commercial mortgage-backed 1,955 1,955
Asset-backed 82 113 878 1,073
State and municipal 10 50 90 9 159
Other debt 4 14 8 61 87
Total debt securities available for sale $670 $2,116 $1,002 $17,096 $20,884
Fair value $667 $2,076 $984 $16,787 $20,514
Weighted-average yield 3.55% 3.94% 4.69% 4.73% 4.61%
Based on current interest rates and expected prepayment speeds, the total weighted-average expected maturity of mortgage-
backed securities was 3 years and 9 months, of commercial mortgage-backed securities was 5 years and of asset-backed securities
was 3 years at December 31, 2005. Weighted-average yields are based on historical cost with effective yields weighted for the
contractual maturity of each security.