PNC Bank 2005 Annual Report Download - page 68
Download and view the complete annual report
Please find page 68 of the 2005 PNC Bank annual report below. You can navigate through the pages in the report by either clicking on the pages listed below, or by using the keyword search tool below to find specific information within the annual report.-
 1
1 -
2
-
3
-
4
-
5
-
6
-
7
-
8
-
9
-
10
-
11
-
12
-
13
-
14
-
15
-
16
-
17
-
18
-
19
-
20
-
21
-
22
-
23
-
24
-
25
-
26
-
27
-
28
-
29
-
30
-
31
-
32
-
33
-
34
-
35
-
36
-
37
-
38
-
39
-
40
-
41
-
42
-
43
-
44
-
45
-
46
-
47
-
48
-
49
-
50
-
51
-
52
-
53
-
54
-
55
-
56
-
57
-
 58
58 -
 59
59 -
 60
60 -
 61
61 -
 62
62 -
 63
63 -
 64
64 -
 65
65 -
 66
66 -
 67
67 -
 68
68 -
 69
69 -
 70
70 -
 71
71 -
 72
72 -
 73
73 -
 74
74 -
 75
75 -
 76
76 -
 77
77 -
 78
78 -
79
-
80
-
81
-
82
-
83
-
84
-
85
-
86
-
87
-
88
-
89
-
90
-
91
-
92
-
93
-
94
-
95
-
96
-
97
-
98
-
99
-
100
-
101
-
102
-
103
-
104
-
105
-
106
-
107
-
108
-
109
-
110
-
111
-
112
-
113
-
114
-
115
-
116
-
117
-
118
-
119
-
120
-
121
-
122
-
123
-
124
-
125
-
126
-
127
-
128
-
129
-
130
-
131
-
132
-
133
-
134
-
135
-
136
-
137
-
138
-
139
-
140
-
141
-
142
-
143
-
144
-
145
-
146
-
147
-
148
-
149
-
150
-
151
-
152
-
153
-
154
-
155
-
156
-
157
-
158
-
159
-
160
-
161
-
162
-
163
-
164
-
165
-
166
-
167
-
168
-
169
-
170
-
171
-
172
-
173
-
174
-
175
-
176
-
177
-
178
-
179
-
180
-
181
-
182
-
183
-
184
-
185
-
186
-
187
-
188
-
189
-
190
-
191
-
192
-
193
-
194
-
195
-
196
-
197
-
198
-
199
-
200
-
201
-
202
-
203
-
204
-
205
-
206
-
207
-
208
-
209
-
210
-
211
-
212
-
213
-
214
-
215
-
216
-
217
-
218
-
219
-
220
-
221
-
222
-
223
-
224
-
225
-
226
-
227
-
228
-
229
-
230
-
231
-
232
-
233
-
234
-
235
-
236
-
237
-
238
-
239
-
240
-
241
-
242
-
243
-
244
-
245
-
246
-
247
-
248
-
249
-
250
-
251
-
252
-
253
-
254
-
255
-
256
-
257
-
258
-
259
-
260
-
261
-
262
-
263
-
264
-
265
-
266
-
267
-
268
-
269
-
270
-
271
-
272
-
273
-
274
-
275
-
276
-
277
-
278
-
279
-
280
-
281
-
282
-
283
-
284
-
285
-
286
-
287
-
288
-
289
-
290
-
291
-
292
-
293
-
294
-
295
-
296
-
297
-
298
-
299
-
300
 |
 |

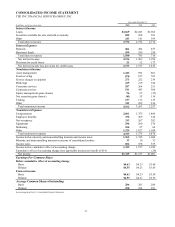
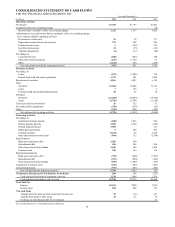
CONSOLIDATED STATEMENT OF CASH FLOWS
THE PNC FINANCIAL SERVICES GROUP, INC.
In millions 2005 2004 2003
Operating Activities
Net income
$1,325 $1,197 $1,001
Cumulative effect of accounting change
28
Income before cumulative effect of accounting change
1,325 1,197 1,029
Adjustments to reconcile income before cumulative effect of accounting change
to net cash provided by operating activities
Provision for credit losses
21 52 177
Depreciation, amortization and accretion
375 302 289
Deferred income taxes
1(194) 216
Securities transactions
41 (55) (116)
Valuation adjustments
(6) (37) (40)
Net change in
Loans held for sale
(680) (265) 348
Other short-term investments
(613) (1,191) 33
Other
(1,140) 654 (230)
Net cash (used) provided by operating activities
(676) 463 1,706
Investing Activities
Net change in
Loans
(187) (3,202) 338
Federal funds sold and resale agreements
1,775 241 1,029
Repayment of securities
4,261 4,297 6,181
Sales
Securities
13,304 14,206 11,514
Loans
7125 3
Foreclosed and other nonperforming assets
20 23 16
Purchases
Securities
(21,484) (18,094) (19,744)
Loans
(2,746) (2,741) (1,530)
Cash received from divestitures
26 512 53
Net cash paid for acquisitions
(530) (299) (63)
Other
(242) (261) (495)
Net cash used by investing activities
(5,796) (5,193) (2,698)
Financing Activities
Net change in
Noninterest-bearing deposits
(280) 1,023 942
Interest-bearing deposits
3,538 4,724 (683)
Federal funds purchased
3,908 131
Repurchase agreements
5265 267
Commercial paper
(2,241) 25 2,226
Other short-term borrowed funds
(404) 775 (1,349)
Sales/issuances
Bank notes and senior debt
2,285 500
Subordinated debt
494 504 894
Other long-term borrowed funds
1,641 464 1,496
Common stock
220 159 134
Repayments/maturities
Bank notes and senior debt
(755) (900) (1,555)
Subordinated debt
(351) (200) (434)
Other long-term borrowed funds
(559) (1,489) (163)
Acquisition of treasury stock
(166) (292) (601)
Cash dividends paid
(575) (566) (546)
Net cash provided by financing activities
6,760 4,992 759
Net Increase (Decrease) In Cash And Due From Banks 288 262 (233)
Cash and due from banks at beginning of period
3,230 2,968 3,201
Cash and due from banks at end of period
$3,518 $3,230 $2,968
Cash Paid For
Interest
$1,515 $782 $736
Income taxes
504 486 165
Non-cash Items
Transfer from (to) loans to (from) loans held for sale, net
93 (32) 101
Transfer from loans to other assets
16 22 16
Exchange of subordinated debt for investments
27
See accompanying Notes To Consolidated Financial Statements.
68
Year ended December 31