PNC Bank 2005 Annual Report Download - page 57
Download and view the complete annual report
Please find page 57 of the 2005 PNC Bank annual report below. You can navigate through the pages in the report by either clicking on the pages listed below, or by using the keyword search tool below to find specific information within the annual report.-
 1
1 -
2
-
3
-
4
-
5
-
6
-
7
-
8
-
9
-
10
-
11
-
12
-
13
-
14
-
15
-
16
-
17
-
18
-
19
-
20
-
21
-
22
-
23
-
24
-
25
-
26
-
27
-
28
-
29
-
30
-
31
-
32
-
33
-
34
-
35
-
36
-
37
-
38
-
39
-
40
-
41
-
42
-
43
-
44
-
45
-
46
-
 47
47 -
 48
48 -
 49
49 -
 50
50 -
 51
51 -
 52
52 -
 53
53 -
 54
54 -
 55
55 -
 56
56 -
 57
57 -
 58
58 -
 59
59 -
 60
60 -
 61
61 -
 62
62 -
 63
63 -
 64
64 -
 65
65 -
 66
66 -
 67
67 -
68
-
69
-
70
-
71
-
72
-
73
-
74
-
75
-
76
-
77
-
78
-
79
-
80
-
81
-
82
-
83
-
84
-
85
-
86
-
87
-
88
-
89
-
90
-
91
-
92
-
93
-
94
-
95
-
96
-
97
-
98
-
99
-
100
-
101
-
102
-
103
-
104
-
105
-
106
-
107
-
108
-
109
-
110
-
111
-
112
-
113
-
114
-
115
-
116
-
117
-
118
-
119
-
120
-
121
-
122
-
123
-
124
-
125
-
126
-
127
-
128
-
129
-
130
-
131
-
132
-
133
-
134
-
135
-
136
-
137
-
138
-
139
-
140
-
141
-
142
-
143
-
144
-
145
-
146
-
147
-
148
-
149
-
150
-
151
-
152
-
153
-
154
-
155
-
156
-
157
-
158
-
159
-
160
-
161
-
162
-
163
-
164
-
165
-
166
-
167
-
168
-
169
-
170
-
171
-
172
-
173
-
174
-
175
-
176
-
177
-
178
-
179
-
180
-
181
-
182
-
183
-
184
-
185
-
186
-
187
-
188
-
189
-
190
-
191
-
192
-
193
-
194
-
195
-
196
-
197
-
198
-
199
-
200
-
201
-
202
-
203
-
204
-
205
-
206
-
207
-
208
-
209
-
210
-
211
-
212
-
213
-
214
-
215
-
216
-
217
-
218
-
219
-
220
-
221
-
222
-
223
-
224
-
225
-
226
-
227
-
228
-
229
-
230
-
231
-
232
-
233
-
234
-
235
-
236
-
237
-
238
-
239
-
240
-
241
-
242
-
243
-
244
-
245
-
246
-
247
-
248
-
249
-
250
-
251
-
252
-
253
-
254
-
255
-
256
-
257
-
258
-
259
-
260
-
261
-
262
-
263
-
264
-
265
-
266
-
267
-
268
-
269
-
270
-
271
-
272
-
273
-
274
-
275
-
276
-
277
-
278
-
279
-
280
-
281
-
282
-
283
-
284
-
285
-
286
-
287
-
288
-
289
-
290
-
291
-
292
-
293
-
294
-
295
-
296
-
297
-
298
-
299
-
300
 |
 |

57
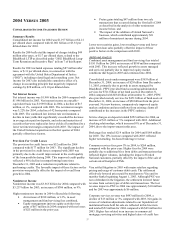
2004 VERSUS 2003
CONSOLIDATED INCOME STATEMENT REVIEW
Summary Results
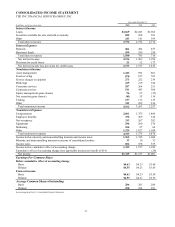
Consolidated net income for 2004 was $1.197 billion or $4.21
per diluted share compared with $1.001 billion or $3.55 per
diluted share for 2003.
Results for 2004 reflected the impact of charges totaling $49
million after taxes, or $.17 per diluted share, related to the
BlackRock LTIP as described under “2002 BlackRock Long-
Term Retention and Incentive Plan” in Item 7 of this Report.
Results for 2003 included expenses totaling $87 million after
taxes, or $.31 per diluted share, in connection with the
agreement with the United States Department of Justice
(“DOJ”), including related legal and consulting costs. Net
income for 2003 also included the cumulative effect of a
change in accounting principle that negatively impacted
earnings by $28 million, or $.10 per diluted share.
Net Interest Income
Net interest income was $1.969 billion for 2004 compared with
$1.996 billion for 2003. Net interest income on a taxable-
equivalent basis was $1.989 billion in 2004, a decline of $17
million, or 1%, compared with 2003. The net interest margin
was 3.22% for 2004, a decline of 42 basis points compared
with 2003. The continued low interest rate environment, a
decline in loan yields that significantly exceeded the decrease
in average rates paid on deposits, and sales and maturities of
securities that were replaced at lower yields all contributed to a
lower net interest margin compared with 2003. The impact of
the United National acquisition in the first quarter of 2004
partially offset these factors.
Provision For Credit Losses
The provision for credit losses was $52 million for 2004
compared with $177 million for 2003. The significant decline
in the provision for credit losses compared with 2003 was
primarily due to the overall improvement in the credit quality
of the loan portfolio during 2004. This improved credit quality
reflected a 46% decline in nonperforming loans since
December 31, 2003 and a reduction in problems related to
performing credits. The favorable impact of these factors on the
provision was partially offset by the impact of overall loan
growth in 2004.
Noninterest Income
Noninterest income was $3.563 billion for 2004 compared with
$3.257 billion for 2003, an increase of $306 million, or 9%.
Higher noninterest income in 2004 reflected the following:
• An increase of $188 million, or 12%, in asset
management and fund servicing fees combined,
• Equity management (private equity activities) net
gains of $67 million in 2004 compared with net losses
of $25 million in the prior year,
• Pretax gains totaling $47 million from two sale
transactions that occurred during the first half of 2004
as described in the analysis of other noninterest
income below, and
• The impact of the addition of United National’ s
business, which contributed approximately $21
million of noninterest income during 2004.
Lower net securities gains, lower trading revenue and lower
gains from loan sales partially offset the impact of these
positive factors in the comparison with 2003.
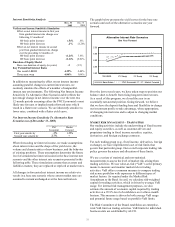
Additional Analysis
Combined asset management and fund servicing fees totaled
$1.811 billion for 2004, an increase of $188 million compared
with 2003. This increase reflected growth in assets managed
and serviced, partially due to improved equity market
conditions that began in 2003 and continued into 2004.
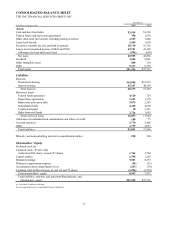
Consolidated assets under management were $383 billion at
December 31, 2004, an increase of $29 billion from December
31, 2003, primarily due to growth in assets managed by
BlackRock. PFPC provided fund accounting/administration
services for $721 billion of net fund assets at December 31,
2004 compared with $654 billion at December 31, 2003. PFPC
also provided custody services for $451 billion of fund assets at
December 31, 2004, an increase of $50 billion from the prior
year-end. Net new business, comparatively improved equity
market conditions and asset inflows from existing clients all
contributed to the increases in the PFPC statistics.
Service charges on deposits totaled $252 million for 2004, an
increase of $13 million or 5% compared with 2003. Additional
checking relationships, which increased 8% as of December 31,
2004, drove the improvement in this area.
Brokerage fees totaled $219 million for 2004 and $184 million
for 2003. The 19% increase compared with 2003 reflected
higher non-trading, fee-based brokerage revenue.
Consumer services fees grew 5% in 2004, to $264 million,
compared with the prior year. Higher fees for 2004 were
partially due to additional fees from debit card transactions that
reflected higher volumes, including the impact of United
National customers, partially offset by the impact of the sale of
certain out-of-footprint ATMs.
Visa settled litigation in 2003 with major retailers regarding
pricing and usage of customer debit cards. The settlement
effectively lowered prices paid by merchants to Visa and its
member banks beginning August 1, 2003. Although PNC was
not a defendant in the litigation, the settlement lowered future
revenue from certain types of debit card transactions. The lost
revenue impact to PNC in 2004 was approximately $10 million
and for 2003 was approximately $6 million.
Corporate services revenue was $493 million for 2004, a
decline of $13 million or 3% compared with 2003. Net gains in
excess of valuation adjustments related to our liquidation of
institutional loans held for sale are reflected in this line item
and totaled $52 million for 2004 compared with $69 million for
2003. Higher fees related to an increase in commercial
mortgage servicing activities and higher letters of credit fees