PNC Bank 2005 Annual Report Download - page 116
Download and view the complete annual report
Please find page 116 of the 2005 PNC Bank annual report below. You can navigate through the pages in the report by either clicking on the pages listed below, or by using the keyword search tool below to find specific information within the annual report.-
 1
1 -
2
-
3
-
4
-
5
-
6
-
7
-
8
-
9
-
10
-
11
-
12
-
13
-
14
-
15
-
16
-
17
-
18
-
19
-
20
-
21
-
22
-
23
-
24
-
25
-
26
-
27
-
28
-
29
-
30
-
31
-
32
-
33
-
34
-
35
-
36
-
37
-
38
-
39
-
40
-
41
-
42
-
43
-
44
-
45
-
46
-
47
-
48
-
49
-
50
-
51
-
52
-
53
-
54
-
55
-
56
-
57
-
58
-
59
-
60
-
61
-
62
-
63
-
64
-
65
-
66
-
67
-
68
-
69
-
70
-
71
-
72
-
73
-
74
-
75
-
76
-
77
-
78
-
79
-
80
-
81
-
82
-
83
-
84
-
85
-
86
-
87
-
88
-
89
-
90
-
91
-
92
-
93
-
94
-
95
-
96
-
97
-
98
-
99
-
100
-
101
-
102
-
103
-
104
-
105
-
 106
106 -
 107
107 -
 108
108 -
 109
109 -
 110
110 -
 111
111 -
 112
112 -
 113
113 -
 114
114 -
 115
115 -
 116
116 -
 117
117 -
 118
118 -
 119
119 -
 120
120 -
 121
121 -
 122
122 -
 123
123 -
 124
124 -
 125
125 -
 126
126 -
127
-
128
-
129
-
130
-
131
-
132
-
133
-
134
-
135
-
136
-
137
-
138
-
139
-
140
-
141
-
142
-
143
-
144
-
145
-
146
-
147
-
148
-
149
-
150
-
151
-
152
-
153
-
154
-
155
-
156
-
157
-
158
-
159
-
160
-
161
-
162
-
163
-
164
-
165
-
166
-
167
-
168
-
169
-
170
-
171
-
172
-
173
-
174
-
175
-
176
-
177
-
178
-
179
-
180
-
181
-
182
-
183
-
184
-
185
-
186
-
187
-
188
-
189
-
190
-
191
-
192
-
193
-
194
-
195
-
196
-
197
-
198
-
199
-
200
-
201
-
202
-
203
-
204
-
205
-
206
-
207
-
208
-
209
-
210
-
211
-
212
-
213
-
214
-
215
-
216
-
217
-
218
-
219
-
220
-
221
-
222
-
223
-
224
-
225
-
226
-
227
-
228
-
229
-
230
-
231
-
232
-
233
-
234
-
235
-
236
-
237
-
238
-
239
-
240
-
241
-
242
-
243
-
244
-
245
-
246
-
247
-
248
-
249
-
250
-
251
-
252
-
253
-
254
-
255
-
256
-
257
-
258
-
259
-
260
-
261
-
262
-
263
-
264
-
265
-
266
-
267
-
268
-
269
-
270
-
271
-
272
-
273
-
274
-
275
-
276
-
277
-
278
-
279
-
280
-
281
-
282
-
283
-
284
-
285
-
286
-
287
-
288
-
289
-
290
-
291
-
292
-
293
-
294
-
295
-
296
-
297
-
298
-
299
-
300
 |
 |

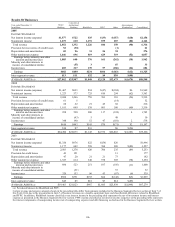
116
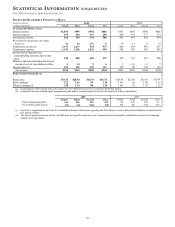
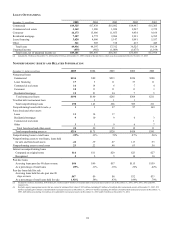
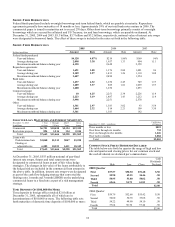
LOANS OUTSTANDING
December 31
-
in millions
2005
2004
2003
2002
2001
Commercial $19,325 $17,438 $15,082 $14,987 $15,205
Commercial real estate 3,162 1,980 1,824 2,267 2,372
Consumer 16,173 15,606 11,855 9,854 9,164
Residential mortgage 7,307 4,772 2,886 3,921 6,395
Lease financing 3,628 4,096 5,147 5,081 5,557
Other 341 505 518 415 445
Total loans
49,936
44,397
37,312
36,525
39,138
Unearned income (835) (902) (1,009) (1,075) (1,164)
Total loans, net of unearned income (a) $49,101 $43,495 $36,303 $35,450 $37,974
(a) Includes $2.3 billion at December 31, 2004 and $2.2 billion at December 31, 2003 related to Market Street, which was deconsolidated effective October 17, 2005.
NONPERFORMING ASSETS AND RELATED INFORMATION
December 31 - dollars in millions 2005 2004 2003 2002 2001
Nonaccrual loans
Commercial $134 $89 $213 $226 $188
Lease financing 17 5 11 57 11
Commercial real estate 14 14 6 7 4
Consumer 10 11 11 11 3
Residential mortgage 15 21 24 7 5
Total nonaccrual loans $190 $140 $265 $308 $211
Troubled debt restructured loan 3 1 1
Total nonperforming loans 190 143 266 309 211
Nonperforming loans held for sale (a) 1 3 27 97 169
Foreclosed and other assets
Lease 13 14 17
Residential mortgage 9 10 9 6 3
Commercial real estate 1
Other 3 5 9 6 7
Total foreclosed and other assets
25
29
35
12
11
Total nonper
forming assets
(b)
$216
$175
$328
$418
$391
Nonperforming loans to total loans .39% .33% .73% .87% .56%
Nonperforming assets to total loans, loans held
for sale and foreclosed assets .42 .39 .87 1.13
.93
Nonperforming assets to total assets .23 .22 .48 .63 .56
Interest on nonperforming loans
Computed on original terms $16 $11 $29 $23 $27
Recognized 5 2 5 10 10
Past due loans
Accruing loans past due 90 days or more $46 $49 $57 $115 $159
As a percentage of total loans .09% .11% .16% .32% .42%
Past due loans held for sale
Accruing loans held for sale past due 90
days or more $47 $9 $6 $32 $33
As a percentage of total loans held for sale 1.92% .54% .43% 1.99% .79%
(a) Includes $1 million, $2 million, $10 million, $17 million and $6 million of troubled debt restructured loans held for sale at December 31, 2005, 2004, 2003, 2002 and 2001,
respectively.
(b) Excludes equity management assets that are carried at estimated fair value of $25 million (including $7 million of troubled debt restructured assets) at December 31, 2005, $32
million (including $11 million of troubled debt restructured assets) at December 31, 2004, $37 million (including $5 million of troubled debt restructured assets) at December 31,
2003, $40 million (including $12 million of troubled debt restructured assets) at December 31, 2002 and $18 million at December 31, 2001.
.