PNC Bank 2005 Annual Report Download - page 28
Download and view the complete annual report
Please find page 28 of the 2005 PNC Bank annual report below. You can navigate through the pages in the report by either clicking on the pages listed below, or by using the keyword search tool below to find specific information within the annual report.-
 1
1 -
2
-
3
-
4
-
5
-
6
-
7
-
8
-
9
-
10
-
11
-
12
-
13
-
14
-
15
-
16
-
17
-
 18
18 -
 19
19 -
 20
20 -
 21
21 -
 22
22 -
 23
23 -
 24
24 -
 25
25 -
 26
26 -
 27
27 -
 28
28 -
 29
29 -
 30
30 -
 31
31 -
 32
32 -
 33
33 -
 34
34 -
 35
35 -
 36
36 -
 37
37 -
 38
38 -
39
-
40
-
41
-
42
-
43
-
44
-
45
-
46
-
47
-
48
-
49
-
50
-
51
-
52
-
53
-
54
-
55
-
56
-
57
-
58
-
59
-
60
-
61
-
62
-
63
-
64
-
65
-
66
-
67
-
68
-
69
-
70
-
71
-
72
-
73
-
74
-
75
-
76
-
77
-
78
-
79
-
80
-
81
-
82
-
83
-
84
-
85
-
86
-
87
-
88
-
89
-
90
-
91
-
92
-
93
-
94
-
95
-
96
-
97
-
98
-
99
-
100
-
101
-
102
-
103
-
104
-
105
-
106
-
107
-
108
-
109
-
110
-
111
-
112
-
113
-
114
-
115
-
116
-
117
-
118
-
119
-
120
-
121
-
122
-
123
-
124
-
125
-
126
-
127
-
128
-
129
-
130
-
131
-
132
-
133
-
134
-
135
-
136
-
137
-
138
-
139
-
140
-
141
-
142
-
143
-
144
-
145
-
146
-
147
-
148
-
149
-
150
-
151
-
152
-
153
-
154
-
155
-
156
-
157
-
158
-
159
-
160
-
161
-
162
-
163
-
164
-
165
-
166
-
167
-
168
-
169
-
170
-
171
-
172
-
173
-
174
-
175
-
176
-
177
-
178
-
179
-
180
-
181
-
182
-
183
-
184
-
185
-
186
-
187
-
188
-
189
-
190
-
191
-
192
-
193
-
194
-
195
-
196
-
197
-
198
-
199
-
200
-
201
-
202
-
203
-
204
-
205
-
206
-
207
-
208
-
209
-
210
-
211
-
212
-
213
-
214
-
215
-
216
-
217
-
218
-
219
-
220
-
221
-
222
-
223
-
224
-
225
-
226
-
227
-
228
-
229
-
230
-
231
-
232
-
233
-
234
-
235
-
236
-
237
-
238
-
239
-
240
-
241
-
242
-
243
-
244
-
245
-
246
-
247
-
248
-
249
-
250
-
251
-
252
-
253
-
254
-
255
-
256
-
257
-
258
-
259
-
260
-
261
-
262
-
263
-
264
-
265
-
266
-
267
-
268
-
269
-
270
-
271
-
272
-
273
-
274
-
275
-
276
-
277
-
278
-
279
-
280
-
281
-
282
-
283
-
284
-
285
-
286
-
287
-
288
-
289
-
290
-
291
-
292
-
293
-
294
-
295
-
296
-
297
-
298
-
299
-
300
 |
 |

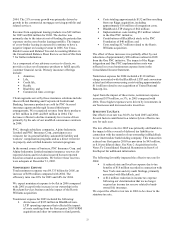
28
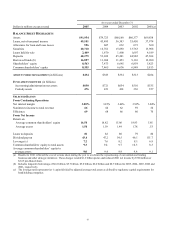
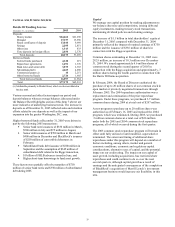
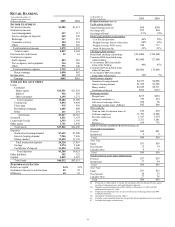
SECURITIES
Details Of Securities Amortized Fair
In millions Cost Value
December 31, 2005 (a)
SECURITIES AVAILABLE FOR SALE
Debt securities
U.S. Treasury and government
agencies $3,816 $3,744
Mortgage-backed 13,794 13,544
Commercial mortgage-backed 1,955 1,919
Asset-backed 1,073 1,063
State and municipal 159 158
Other debt 87 86
Corporate stocks and other 196 196
Total securities available for sale $21,080 $20,710
December 31, 2004
SECURITIES AVAILABLE FOR SALE
Debt securities
U.S. Treasury and government
agencies $4,735 $4,722
Mortgage-backed 8,506 8,433
Commercial mortgage-backed 1,380 1,370
Asset-backed 1,910 1,901
State and municipal 175 176
Other debt 33 33
Corporate stocks and other 123 125
Total securities available for sale $16,862 $16,760
S
ECURITIES
H
ELD TO
M
ATURITY
Debt securities
Asset-backed $1 $1
Total securities held to maturity $1 $1
(a) Securities held to maturity at December 31, 2005 were less than $.5
million.
Securities represented 23% of total assets at December 31,
2005 compared with 21% at December 31, 2004. The
increase in total securities compared with December 31,
2004 was primarily due to the acquisition of Riggs and
normal portfolio activity.
At December 31, 2005, the securities available for sale
balance included a net unrealized loss of $370 million, which
represented the difference between fair value and amortized
cost. The comparable amount at December 31, 2004 was a net
unrealized loss of $102 million. The increase in the net
unrealized loss at December 31, 2005 reflected the impact on
bond prices of increases in interest rates during 2005 partially
offset by the sales of securities during the second quarter of
2005 as discussed below.
We evaluate our portfolio of securities available for sale in
light of changing market conditions and other factors and,
where appropriate, take steps intended to improve our
overall positioning. In late April and early May 2005 we
sold $2.1 billion of securities available for sale and
terminated $1.0 billion of resale agreements that were most
sensitive to extension risk due to rising short-term interest
rates. We also purchased $2.1 billion of securities with
higher yields and lower extension risk. These transactions
resulted in realized net securities and other losses of
approximately $31 million, which are included in our results
of operations for 2005.
The fair value of securities available for sale decreases when
interest rates increase and vice versa. Further increases in
interest rates in 2006, if sustained, will adversely impact the
fair value of securities available for sale going forward
compared with the fair value at December 31, 2005. Net
unrealized gains and losses in the securities available for sale
portfolio are included in shareholders’ equity as accumulated
other comprehensive income or loss, net of tax.
The expected weighted-average life of securities available
for sale was 4 years and 1 month at December 31, 2005
compared with 2 years and 8 months at December 31, 2004.
We estimate that at December 31, 2005 the effective
duration of securities available for sale is 2.7 years for an
immediate 50 basis points parallel increase in interest rates
and 2.4 years for an immediate 50 basis points parallel
decrease in interest rates. Comparable amounts at
December 31, 2004 were 2.7 years and 2.3 years,
respectively.
LOANS HELD FOR SALE
Education loans held for sale totaled $1.9 billion at
December 31, 2005 and $1.1 billion at December 31, 2004
and represented the majority of our loans held for sale at
each date. We classify substantially all of our education
loans as loans held for sale. Generally, we sell education
loans when the loans are placed into repayment status.
Gains on sales of education loans totaled $19 million for
2005, $30 million for 2004 and $20 million for 2003. These
gains are reflected in the other noninterest income line item
in our Consolidated Income Statement and in the results of
the Retail Banking segment.
Our liquidation of institutional loans held for sale resulted in
net gains in excess of valuation adjustments of $7 million in
2005, $52 million in 2004 and $69 million in 2003. These
gains are reflected in the corporate services line item in our
Consolidated Income Statement and in the results of the
Corporate & Institutional Banking business segment. This
liquidation has now been completed.
OTHER ASSETS
The increase of $1.9 billion in “Assets -Other” in the
preceding “Summarized Balance Sheet Data” table includes
the impact of increases in goodwill and other intangible
assets arising from three 2005 acquisitions along with an
increase in accounts receivable. Goodwill and other
intangible assets recorded in connection with the Riggs,
SSRM and Harris Williams acquisitions totaled $1.0 billion
in 2005. See Note 9 Goodwill and Other Intangible Assets
in the Notes To Consolidated Financial Statements in Item 8
of this Report for further information. In addition, accounts
receivable included in other assets increased $.6 billion at
December 31, 2005 compared with the prior year-end, due
in part to increases at PFPC and BlackRock.