PNC Bank 2005 Annual Report Download - page 21
Download and view the complete annual report
Please find page 21 of the 2005 PNC Bank annual report below. You can navigate through the pages in the report by either clicking on the pages listed below, or by using the keyword search tool below to find specific information within the annual report.-
 1
1 -
2
-
3
-
4
-
5
-
6
-
7
-
8
-
9
-
10
-
 11
11 -
 12
12 -
 13
13 -
 14
14 -
 15
15 -
 16
16 -
 17
17 -
 18
18 -
 19
19 -
 20
20 -
 21
21 -
 22
22 -
 23
23 -
 24
24 -
 25
25 -
 26
26 -
 27
27 -
 28
28 -
 29
29 -
 30
30 -
 31
31 -
32
-
33
-
34
-
35
-
36
-
37
-
38
-
39
-
40
-
41
-
42
-
43
-
44
-
45
-
46
-
47
-
48
-
49
-
50
-
51
-
52
-
53
-
54
-
55
-
56
-
57
-
58
-
59
-
60
-
61
-
62
-
63
-
64
-
65
-
66
-
67
-
68
-
69
-
70
-
71
-
72
-
73
-
74
-
75
-
76
-
77
-
78
-
79
-
80
-
81
-
82
-
83
-
84
-
85
-
86
-
87
-
88
-
89
-
90
-
91
-
92
-
93
-
94
-
95
-
96
-
97
-
98
-
99
-
100
-
101
-
102
-
103
-
104
-
105
-
106
-
107
-
108
-
109
-
110
-
111
-
112
-
113
-
114
-
115
-
116
-
117
-
118
-
119
-
120
-
121
-
122
-
123
-
124
-
125
-
126
-
127
-
128
-
129
-
130
-
131
-
132
-
133
-
134
-
135
-
136
-
137
-
138
-
139
-
140
-
141
-
142
-
143
-
144
-
145
-
146
-
147
-
148
-
149
-
150
-
151
-
152
-
153
-
154
-
155
-
156
-
157
-
158
-
159
-
160
-
161
-
162
-
163
-
164
-
165
-
166
-
167
-
168
-
169
-
170
-
171
-
172
-
173
-
174
-
175
-
176
-
177
-
178
-
179
-
180
-
181
-
182
-
183
-
184
-
185
-
186
-
187
-
188
-
189
-
190
-
191
-
192
-
193
-
194
-
195
-
196
-
197
-
198
-
199
-
200
-
201
-
202
-
203
-
204
-
205
-
206
-
207
-
208
-
209
-
210
-
211
-
212
-
213
-
214
-
215
-
216
-
217
-
218
-
219
-
220
-
221
-
222
-
223
-
224
-
225
-
226
-
227
-
228
-
229
-
230
-
231
-
232
-
233
-
234
-
235
-
236
-
237
-
238
-
239
-
240
-
241
-
242
-
243
-
244
-
245
-
246
-
247
-
248
-
249
-
250
-
251
-
252
-
253
-
254
-
255
-
256
-
257
-
258
-
259
-
260
-
261
-
262
-
263
-
264
-
265
-
266
-
267
-
268
-
269
-
270
-
271
-
272
-
273
-
274
-
275
-
276
-
277
-
278
-
279
-
280
-
281
-
282
-
283
-
284
-
285
-
286
-
287
-
288
-
289
-
290
-
291
-
292
-
293
-
294
-
295
-
296
-
297
-
298
-
299
-
300
 |
 |
21
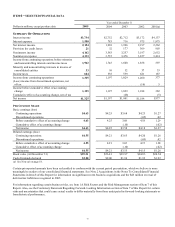
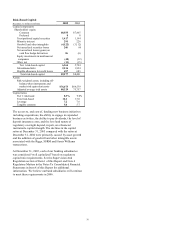
See Note 21 Segment Reporting in the Notes To
Consolidated Financial Statements in Item 8 of this Report
for a reconciliation of total business segment earnings to
total PNC consolidated earnings as reported on a GAAP
basis, and see Net Interest Income - GAAP Reconciliation
in the Consolidated Income Statement Review section of
Item 7 of this Report for a reconciliation of net income as
reported under GAAP to net interest income presented on a
taxable-equivalent basis.
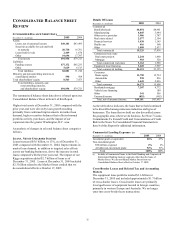
BALANCE SHEET HIGHLIGHTS
Total average assets were $88.5 billion for 2005 compared
with $75.3 billion for 2004. Average interest-earning assets
were $73.0 billion in 2005 compared with $61.8 billion in
2004, an increase of $11.2 billion or 18%. An increase of
$6.4 billion in average loans was the primary factor for the
increase in average interest-earning assets. In addition,
average total securities increased $3.4 billion in 2005
compared with 2004.
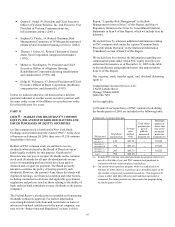
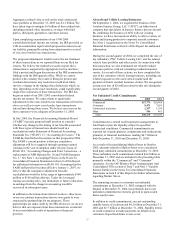
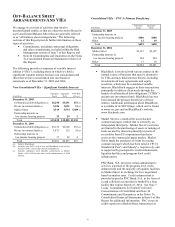
In October 2005, Market Street Funding LLC (“Market
Street”), formerly Market Street Funding Corporation, was
restructured as a limited liability company and entered into a
subordinated Note Purchase Agreement (“Note”) with an
unrelated third party. As a result of the Note issuance, we
reevaluated whether PNC continued to be the primary
beneficiary of Market Street under the provisions of
Financial Accounting Standards Board (“FASB”)
Interpretation No. 46 (Revised 2003), “Consolidation of
Variable Interest Entities” (“FIN 46R”). Based on this
analysis, we determined that we were no longer the primary
beneficiary and deconsolidated Market Street from our
Consolidated Balance Sheet effective October 17, 2005.
You can find additional information on Market Street within
the Off-Balance Sheet Arrangements And VIEs section of
Item 7 of this Report.
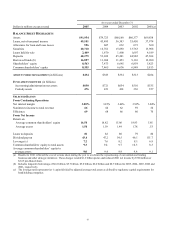
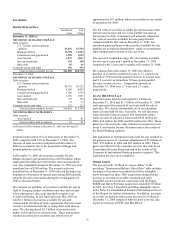
Average total loans were $47.4 billion for 2005 and $40.9
billion in 2004. This increase was driven by continued
improvements in market loan demand and targeted sales
efforts across our banking businesses, as well as the impact
of our expansion into the greater Washington, D.C. area.
The increase in average total loans reflected growth in
commercial loans of approximately $2.4 billion, consumer
loans of approximately $2.0 billion and residential
mortgages of approximately $2.1 billion, partially offset by
a $.5 billion decline in lease financing loans. We sold our
vehicle leasing business in 2004 as described under the
Aircraft and Vehicle Leasing Businesses section of the
Consolidated Balance Sheet Review section of Item 7 of this
Report. Loans represented 65% of average interest-earning
assets for 2005 and 66% for 2004.
Average securities totaled $19.3 billion for 2005 and $15.9
billion for 2004. Of this $3.4 billion increase, $2.5 billion
was attributable to increases in mortgage-backed, asset-
backed and other debt securities. The increase in 2005 also
reflected the impact of Riggs. Securities comprised 26% of
average interest-earning assets for 2005 and 2004.
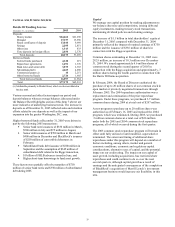
Average total deposits were $57.6 billion for 2005, an
increase of $7.9 billion over 2004. The increase in average
total deposits was driven primarily by the impact of higher
certificates of deposit, money market account and
noninterest-bearing deposit balances, and by higher
Eurodollar deposits. The increase in 2005 also reflected the
impact of our expansion into the greater Washington, D.C.
area. Average total deposits represented 65% of total
sources of funds for 2005 and 66% for 2004. Average
transaction deposits were $39.5 billion for 2005 compared
with $35.9 billion for 2004.
Average borrowed funds were $16.2 billion for 2005 and
$12.5 billion for 2004. The following contributed to this
increase:
• Various issuances of senior and subordinated bank
notes and Federal Home Loan Bank (“FHLB”)
advances throughout 2005, as further detailed
within Capital and Funding Sources in the
Consolidated Balance Sheet Review section of this
Financial Review, along with the comparative
impact of $500 million of subordinated bank notes
issued in December 2004 and $500 million of
senior bank notes issued in September 2004,
• The assumption of approximately $345 million of
subordinated debt in 2005 with the Riggs
acquisition,
• BlackRock’ s issuance of $250 million of
convertible debentures in February 2005, and
• An increase in short-term borrowings to fund asset
growth.
These increases were partially offset by maturing FHLB
advances, senior bank notes, and senior and subordinated
debt in 2004 and 2005.
Shareholders’ equity totaled $8.6 billion at December 31,
2005, compared with $7.5 billion at December 31, 2004.
See the Consolidated Balance Sheet Review section of Item
7 of this Report for additional information.