PNC Bank 2005 Annual Report Download - page 56
Download and view the complete annual report
Please find page 56 of the 2005 PNC Bank annual report below. You can navigate through the pages in the report by either clicking on the pages listed below, or by using the keyword search tool below to find specific information within the annual report.-
 1
1 -
2
-
3
-
4
-
5
-
6
-
7
-
8
-
9
-
10
-
11
-
12
-
13
-
14
-
15
-
16
-
17
-
18
-
19
-
20
-
21
-
22
-
23
-
24
-
25
-
26
-
27
-
28
-
29
-
30
-
31
-
32
-
33
-
34
-
35
-
36
-
37
-
38
-
39
-
40
-
41
-
42
-
43
-
44
-
45
-
 46
46 -
 47
47 -
 48
48 -
 49
49 -
 50
50 -
 51
51 -
 52
52 -
 53
53 -
 54
54 -
 55
55 -
 56
56 -
 57
57 -
 58
58 -
 59
59 -
 60
60 -
 61
61 -
 62
62 -
 63
63 -
 64
64 -
 65
65 -
 66
66 -
67
-
68
-
69
-
70
-
71
-
72
-
73
-
74
-
75
-
76
-
77
-
78
-
79
-
80
-
81
-
82
-
83
-
84
-
85
-
86
-
87
-
88
-
89
-
90
-
91
-
92
-
93
-
94
-
95
-
96
-
97
-
98
-
99
-
100
-
101
-
102
-
103
-
104
-
105
-
106
-
107
-
108
-
109
-
110
-
111
-
112
-
113
-
114
-
115
-
116
-
117
-
118
-
119
-
120
-
121
-
122
-
123
-
124
-
125
-
126
-
127
-
128
-
129
-
130
-
131
-
132
-
133
-
134
-
135
-
136
-
137
-
138
-
139
-
140
-
141
-
142
-
143
-
144
-
145
-
146
-
147
-
148
-
149
-
150
-
151
-
152
-
153
-
154
-
155
-
156
-
157
-
158
-
159
-
160
-
161
-
162
-
163
-
164
-
165
-
166
-
167
-
168
-
169
-
170
-
171
-
172
-
173
-
174
-
175
-
176
-
177
-
178
-
179
-
180
-
181
-
182
-
183
-
184
-
185
-
186
-
187
-
188
-
189
-
190
-
191
-
192
-
193
-
194
-
195
-
196
-
197
-
198
-
199
-
200
-
201
-
202
-
203
-
204
-
205
-
206
-
207
-
208
-
209
-
210
-
211
-
212
-
213
-
214
-
215
-
216
-
217
-
218
-
219
-
220
-
221
-
222
-
223
-
224
-
225
-
226
-
227
-
228
-
229
-
230
-
231
-
232
-
233
-
234
-
235
-
236
-
237
-
238
-
239
-
240
-
241
-
242
-
243
-
244
-
245
-
246
-
247
-
248
-
249
-
250
-
251
-
252
-
253
-
254
-
255
-
256
-
257
-
258
-
259
-
260
-
261
-
262
-
263
-
264
-
265
-
266
-
267
-
268
-
269
-
270
-
271
-
272
-
273
-
274
-
275
-
276
-
277
-
278
-
279
-
280
-
281
-
282
-
283
-
284
-
285
-
286
-
287
-
288
-
289
-
290
-
291
-
292
-
293
-
294
-
295
-
296
-
297
-
298
-
299
-
300
 |
 |

56
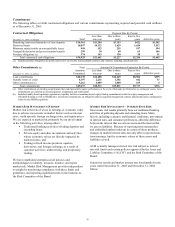
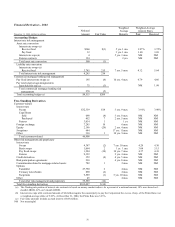
Financial Derivatives - 2004
Notional
Weighted
Average
Weighted-Average
Interest Rates
December 31, 2004 - dollars in millions
Amount
Fair Value
Maturity
Paid
Received
Accounting Hedges
Interest rate risk management
Asset rate conversion
Interest rate swaps (a)
Receive fixed $360 $(1) 5 yrs. 1 mo. 3.97% 3.72%
Pay fixed 12 3 yrs. 1 mo. 3.68 3.69
Interest rate caps (b) 4 5 yrs. 3 mos. NM NM
Futures contracts 124 2 yrs. NM NM
Total asset rate conversion 500 (1)
Liability rate conversion
Interest rate swaps (a)
Receive fixed 3,745 215 7 yrs. 5 mos. 4.12 5.64
Total interest rate risk management 4,245 214
Commercial mortgage banking risk management
Pay fixed interest rate swaps (a) 195 (4) 10 yrs. 4 mos. 4.79 4.66
Pay total return swaps designated to
loans held for sale (a) 75 (1) NM 1.98
Total commercial mortgage banking risk
management 270 (5)
Total accounting hedges (c) $4,515 $209
Free-Standing Derivatives
Customer-related
Interest rate
Swaps $32,339 $18 3 yrs. 9 mos. 3.91% 3.90%
Caps/floors
Sold 698 (8) 3 yrs. 8 mos. NM NM
Purchased 452 7 2 yrs. 5 mos. NM NM
Futures 3,014 1 1 yr. NM NM
Foreign exchange 7,245 10 6 mos. NM NM
Equity 2,186 (29) 2 yrs. 4 mos. NM NM
Swaptions 644 17 yrs. 11mos. NM NM
Other 330 1 10 yrs. 9 mos. NM NM
Total customer-related 46,908
Other risk management and proprietary
Interest rate
Swaps 4,347 (2) 7 yrs. 10 mos. 4.29 4.30
Basis swaps 1,064 2 1 yr. 1 mo. 3.04 3.15
Pay fixed swaps 1,204 (10) 10 yrs. 7 mos. 4.37 4.41
Futures 9,329 2 yrs. 4 mos. NM NM
Credit derivatives 359 (4) 4 yrs. 5 mos. NM NM
Risk participation agreements 230 6 yrs. 8 mos. NM NM
Commitments related to mortgage-related assets 782 1 2 mos. NM NM
Options
Eurodollar 27,750 2 4 mos.
NM NM
Treasury notes/bonds 890 (2) 2 mos. NM NM
Swaptions 9,589 (1) 5 yrs. 10 mos. NM NM
Other 45 4 mos. NM NM
Total other risk management and proprietary 55,589 (14)
Total free-standing derivatives $102,497 $(14)
(a) The floating rate portion of interest rate contracts is based on money-market indices. As a percent of a notional amount, 38% were based on 1-
month LIBOR, 62% on 3-month LIBOR.
(b) Interest rate caps with a notional amount of $4 million require the counterparty to pay the Corporation the excess, if any, of the Prime Rate over
a weighted-average strike of 5.03%. At December 31, 2004, the Prime Rate was 5.25%.
(c) Fair value amounts include accrued interest of $45 million.
NM Not meaningful