PNC Bank 2005 Annual Report Download - page 55
Download and view the complete annual report
Please find page 55 of the 2005 PNC Bank annual report below. You can navigate through the pages in the report by either clicking on the pages listed below, or by using the keyword search tool below to find specific information within the annual report.-
 1
1 -
 2
2 -
 3
3 -
 4
4 -
 5
5 -
 6
6 -
 7
7 -
 8
8 -
 9
9 -
 10
10 -
 11
11 -
 12
12 -
 13
13 -
 14
14 -
 15
15 -
 16
16 -
 17
17 -
 18
18 -
 19
19 -
 20
20 -
 21
21 -
 22
22 -
 23
23 -
 24
24 -
 25
25 -
 26
26 -
 27
27 -
 28
28 -
 29
29 -
 30
30 -
 31
31 -
 32
32 -
 33
33 -
 34
34 -
 35
35 -
 36
36 -
 37
37 -
 38
38 -
 39
39 -
 40
40 -
 41
41 -
 42
42 -
 43
43 -
 44
44 -
 45
45 -
 46
46 -
 47
47 -
 48
48 -
 49
49 -
 50
50 -
 51
51 -
 52
52 -
 53
53 -
 54
54 -
 55
55 -
 56
56 -
 57
57 -
 58
58 -
 59
59 -
 60
60 -
 61
61 -
 62
62 -
 63
63 -
 64
64 -
 65
65 -
 66
66 -
 67
67 -
 68
68 -
 69
69 -
 70
70 -
 71
71 -
 72
72 -
 73
73 -
 74
74 -
 75
75 -
 76
76 -
 77
77 -
 78
78 -
 79
79 -
 80
80 -
 81
81 -
 82
82 -
 83
83 -
 84
84 -
 85
85 -
 86
86 -
 87
87 -
 88
88 -
 89
89 -
 90
90 -
 91
91 -
 92
92 -
 93
93 -
 94
94 -
 95
95 -
 96
96 -
 97
97 -
 98
98 -
 99
99 -
 100
100 -
 101
101 -
 102
102 -
 103
103 -
 104
104 -
 105
105 -
 106
106 -
 107
107 -
 108
108 -
 109
109 -
 110
110 -
 111
111 -
 112
112 -
 113
113 -
 114
114 -
 115
115 -
 116
116 -
 117
117 -
 118
118 -
 119
119 -
 120
120 -
 121
121 -
 122
122 -
 123
123 -
 124
124 -
 125
125 -
 126
126 -
 127
127 -
 128
128 -
 129
129 -
 130
130 -
 131
131 -
 132
132 -
 133
133 -
 134
134 -
 135
135 -
 136
136 -
 137
137 -
 138
138 -
 139
139 -
 140
140 -
 141
141 -
 142
142 -
 143
143 -
 144
144 -
 145
145 -
 146
146 -
 147
147 -
 148
148 -
 149
149 -
 150
150 -
 151
151 -
 152
152 -
 153
153 -
 154
154 -
 155
155 -
 156
156 -
 157
157 -
 158
158 -
 159
159 -
 160
160 -
 161
161 -
 162
162 -
 163
163 -
 164
164 -
 165
165 -
 166
166 -
 167
167 -
 168
168 -
 169
169 -
 170
170 -
 171
171 -
 172
172 -
 173
173 -
 174
174 -
 175
175 -
 176
176 -
 177
177 -
 178
178 -
 179
179 -
 180
180 -
 181
181 -
 182
182 -
 183
183 -
 184
184 -
 185
185 -
 186
186 -
 187
187 -
 188
188 -
 189
189 -
 190
190 -
 191
191 -
 192
192 -
 193
193 -
 194
194 -
 195
195 -
 196
196 -
 197
197 -
 198
198 -
 199
199 -
 200
200 -
 201
201 -
 202
202 -
 203
203 -
 204
204 -
 205
205 -
 206
206 -
 207
207 -
 208
208 -
 209
209 -
 210
210 -
 211
211 -
 212
212 -
 213
213 -
 214
214 -
 215
215 -
 216
216 -
 217
217 -
 218
218 -
 219
219 -
 220
220 -
 221
221 -
 222
222 -
 223
223 -
 224
224 -
 225
225 -
 226
226 -
 227
227 -
 228
228 -
 229
229 -
 230
230 -
 231
231 -
 232
232 -
 233
233 -
 234
234 -
 235
235 -
 236
236 -
 237
237 -
 238
238 -
 239
239 -
 240
240 -
 241
241 -
 242
242 -
 243
243 -
 244
244 -
 245
245 -
 246
246 -
 247
247 -
 248
248 -
 249
249 -
 250
250 -
 251
251 -
 252
252 -
 253
253 -
 254
254 -
 255
255 -
 256
256 -
 257
257 -
 258
258 -
 259
259 -
 260
260 -
 261
261 -
 262
262 -
 263
263 -
 264
264 -
 265
265 -
 266
266 -
 267
267 -
 268
268 -
 269
269 -
 270
270 -
 271
271 -
 272
272 -
 273
273 -
 274
274 -
 275
275 -
 276
276 -
 277
277 -
 278
278 -
 279
279 -
 280
280 -
 281
281 -
 282
282 -
 283
283 -
 284
284 -
 285
285 -
 286
286 -
 287
287 -
 288
288 -
 289
289 -
 290
290 -
 291
291 -
 292
292 -
 293
293 -
 294
294 -
 295
295 -
 296
296 -
 297
297 -
 298
298 -
 299
299 -
 300
300
 |
 |

55
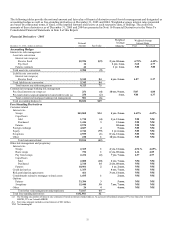
The following tables provide the notional amount and fair value of financial derivatives used for risk management and designated as
accounting hedges as well as free-standing derivatives at December 31, 2005 and 2004. Weighted-average interest rates presented
are based on contractual terms, if fixed, or the implied forward yield curve at each respective date, if floating. The credit risk
amounts of these derivatives as of December 31, 2005 and 2004 are presented in Note 16 Financial Derivatives in the Notes To
Consolidated Financial Statements in Item 8 of this Report.
Financial Derivatives - 2005
Notional
Weighted
Average
Weighted-Average
Interest Rates
Decemb er 31, 2005 - dollars in millions
Amount
Fair Value
Maturity
Paid
Received
Accounting Hedges
Interest rate risk management
Asset rate conversion
Interest rate swaps (a)
Receive fixed $2,926 $(9) 2 yrs. 10 mos. 4.75% 4.42%
Pay fixed 12 2 yrs. 1 mo. 3.68 4.77
Futures contracts 42 1 yr. 1 mo. NM NM
Total asset rate conversion 2,980 (9)
Liability rate conversion
Interest rate swaps (a)
Receive fixed 5,345 84 6 yrs. 5 mos. 4.87 5.37
Total liability rate conversion 5,345 84
Total interest rate risk management 8,325 75
Commercial mortgage banking risk management
Pay fixed interest rate swaps (a) 251 (4) 10 yrs. 9 mos. 5.05 4.88
Pay total return swaps designated to loans held for sale (a) 250 (2) 1 mo. NM 4.37
Total commercial mortgage banking risk management 501 (6)
Total accounting hedges (b) $8,826 $69
Free-Standing Derivatives
Customer-related
Interest rate
Swaps $43,868 $34 4 yrs. 2 mos. 4.69% 4.69%
Caps/floors
Sold 1,710 (4) 1 yr. 11 mos.
NM NM
Purchased 1,446 3 11 mos.
NM NM
Futures 2,570 10 mos. NM NM
Foreign exchange 4,687 4 5 mos. NM NM
Equity 2,744 (79) 1 yr. 6 mos. NM NM
Swaptions 2,559 (1) 8 yrs. 11 mos. NM NM
Other 230 1 10 yrs. 8 mos. NM NM
Total customer-related 59,814 (42)
Other risk management and proprietary
Interest rate
Swaps 2,369 1 4 yrs. 11 mos. 4.56 % 4.65%
Basis swaps 756 1 6 yrs. 10 mos. 4.14 4.85
Pay fixed swaps 2,474 (2) 7 yrs. 7 mos. 4.37 4.57
Caps/floors
Sold 2,000 (10) 2 yrs. 7 mos. NM NM
Purchased 2,310 14 2 yrs. 10 mos. NM NM
Futures 10,901 2 1 yr. 2 mos. NM NM
Credit derivatives 1,353 4 yrs. 7 mos. NM NM
Risk participation agreements 461 3 yrs. 11 mos. NM NM
Commitments related to mortgage-related assets 1,695 1 2 mos. NM NM
Options
Futures 33,384 3 5 mos.
NM NM
Swaptions 15,440 30 7 yrs. 7 mos. NM NM
Other 24 4 4 mos. NM NM
Total other risk management and proprietary 73,167 44
Total free-standing derivatives $132,981 $2
(a) The floating rate portion of interest rate contracts is based on money-market indices. As a percent of notional amount, 67% were based on 1-month
LIBOR, 33% on 3-month LIBOR.
(b) Fair value amounts include accrued interest of $81 million.
NM Not meaningful
