PNC Bank 2005 Annual Report Download - page 37
Download and view the complete annual report
Please find page 37 of the 2005 PNC Bank annual report below. You can navigate through the pages in the report by either clicking on the pages listed below, or by using the keyword search tool below to find specific information within the annual report.-
 1
1 -
2
-
3
-
4
-
5
-
6
-
7
-
8
-
9
-
10
-
11
-
12
-
13
-
14
-
15
-
16
-
17
-
18
-
19
-
20
-
21
-
22
-
23
-
24
-
25
-
26
-
 27
27 -
 28
28 -
 29
29 -
 30
30 -
 31
31 -
 32
32 -
 33
33 -
 34
34 -
 35
35 -
 36
36 -
 37
37 -
 38
38 -
 39
39 -
 40
40 -
 41
41 -
 42
42 -
 43
43 -
 44
44 -
 45
45 -
 46
46 -
 47
47 -
48
-
49
-
50
-
51
-
52
-
53
-
54
-
55
-
56
-
57
-
58
-
59
-
60
-
61
-
62
-
63
-
64
-
65
-
66
-
67
-
68
-
69
-
70
-
71
-
72
-
73
-
74
-
75
-
76
-
77
-
78
-
79
-
80
-
81
-
82
-
83
-
84
-
85
-
86
-
87
-
88
-
89
-
90
-
91
-
92
-
93
-
94
-
95
-
96
-
97
-
98
-
99
-
100
-
101
-
102
-
103
-
104
-
105
-
106
-
107
-
108
-
109
-
110
-
111
-
112
-
113
-
114
-
115
-
116
-
117
-
118
-
119
-
120
-
121
-
122
-
123
-
124
-
125
-
126
-
127
-
128
-
129
-
130
-
131
-
132
-
133
-
134
-
135
-
136
-
137
-
138
-
139
-
140
-
141
-
142
-
143
-
144
-
145
-
146
-
147
-
148
-
149
-
150
-
151
-
152
-
153
-
154
-
155
-
156
-
157
-
158
-
159
-
160
-
161
-
162
-
163
-
164
-
165
-
166
-
167
-
168
-
169
-
170
-
171
-
172
-
173
-
174
-
175
-
176
-
177
-
178
-
179
-
180
-
181
-
182
-
183
-
184
-
185
-
186
-
187
-
188
-
189
-
190
-
191
-
192
-
193
-
194
-
195
-
196
-
197
-
198
-
199
-
200
-
201
-
202
-
203
-
204
-
205
-
206
-
207
-
208
-
209
-
210
-
211
-
212
-
213
-
214
-
215
-
216
-
217
-
218
-
219
-
220
-
221
-
222
-
223
-
224
-
225
-
226
-
227
-
228
-
229
-
230
-
231
-
232
-
233
-
234
-
235
-
236
-
237
-
238
-
239
-
240
-
241
-
242
-
243
-
244
-
245
-
246
-
247
-
248
-
249
-
250
-
251
-
252
-
253
-
254
-
255
-
256
-
257
-
258
-
259
-
260
-
261
-
262
-
263
-
264
-
265
-
266
-
267
-
268
-
269
-
270
-
271
-
272
-
273
-
274
-
275
-
276
-
277
-
278
-
279
-
280
-
281
-
282
-
283
-
284
-
285
-
286
-
287
-
288
-
289
-
290
-
291
-
292
-
293
-
294
-
295
-
296
-
297
-
298
-
299
-
300
 |
 |

37
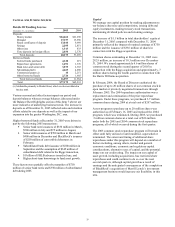
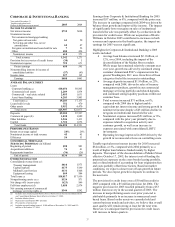
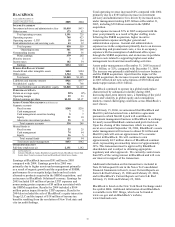
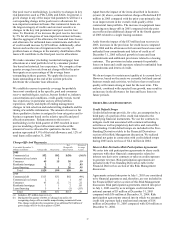
CORPORATE & INSTITUTIONAL BANKING
Year ended December 31
Taxable-equivalent basis
Dollars in millions except as noted
2005
2004
INCOME STATEMENT
Net interest income $732 $698
Noninterest income
Net commercial mortgage banking
Net gains on loan sales 61 50
Servicing and other fees, net of
amortization 62 47
Net gains on institutional loans held for sale
7 52
Other 480 424
Noninterest income 610 573
Total revenue 1,342 1,271
Provision for (recoveries of) credit losses (30) 5
Noninterest expense 722 671
Pretax earnings 650 595
Noncontrolling interests in income of
consolidated entities (57) (43)
Income taxes 227 195
Earnings $480 $443
AVERAGE BALANCE SHEET
Loans
Corporate banking (a) $10,656 $9,865
Commercial real estate 2,289 1,834
Commercial – real estate related 2,055 1,631
Asset-based lending 4,203 3,803
Total loans (a) 19,203 17,133
Loans held for sale 752 470
Other assets 5,952 4,470
Total assets $25,907 $22,073
Deposits $9,382 $7,527
Commercial paper (b) 1,838 1,889
Other liabilities 3,946 3,433
Capital 1,724 1,672
Total funds $16,890 $14,521
PERFORMANCE RATIOS
Return on average capital 28%
26%
Noninterest income to total revenue 45 45
Efficiency 54 53
COMMERCIAL MORTGAGE
SERVICING PORTFOLIO (in billions)
Beginning of period $98 $83
Acquisitions/additions 74 41
Repayments/transfers (36) (26)
End of period $136 $98
OTHER INFORMATION
Consolidated revenue from (c):
Treasury management $410 $373
Capital markets $175 $140
Midland Loan Services $131 $108
Equipment leasing $69 $84
Total loans (d) $18,817 $17,959
Nonperforming assets (d) (e) $124 $71
Net charge-offs (recoveries) $(23) $49
Full-time employees (d) 3,050 2,974
Net carrying amount of commercial
mortgage servicing rights (d) $344 $242
(a) Includes lease financing and Market Street. Market Street was deconsolidated from
our Consolidated Balance Sheet effective October 17, 2005.
(b) Includes Market Street.
(c) Represents consolidated PNC amounts.
(d) Presented as of period end.
(e) Includes nonperforming loans of $108 million at December 31, 2005 and $51
million at December 31, 2004.
Earnings from Corporate & Institutional Banking for 2005
increased $37 million, or 8%, compared with the prior year.
The increase in earnings compared with 2004 was driven by
balance sheet growth and improved fee income. The impact
of significantly lower net gains on sales of institutional
loans held for sale was partially offset by a reduction in the
provision for credit losses. While our acquisition of Harris
Williams in October 2005 contributed to increases in both
revenues and expenses in the fourth quarter, the impact on
earnings for 2005 was not significant.
Highlights for Corporate & Institutional Banking’ s 2005
results included:
• Average loan balances increased $2.1 billion, or
12%, over 2004, including the impact of the
deconsolidation of the Market Street conduit.
While usage has remained relatively constant year
over year, growth was driven by continued strong
customer demand and PNC’ s expansion into the
greater Washington, D.C. area. Growth in all loan
categories fueled the increase in outstandings.
• Average deposits increased $1.9 billion, or 25%,
compared with 2004, driven by sales of treasury
management products, growth in our commercial
mortgage servicing portfolio and related deposits,
and continued strong liquidity positions within our
customer base.
• Total revenue increased $71 million, or 6%,
compared with 2004 due to higher taxable -
equivalent net interest income and strong growth in
noninterest income despite a $45 million decline in
net gains on institutional loans held for sale.
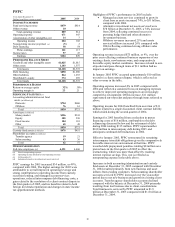
• Noninterest expense increased $51 million, or 8%,
compared with the prior year primarily due to
expenses related to acquisition activity and
customer growth, as well as an increase in
expenses associated with consolidated LIHTC
investments.
• Operating leverage improved in 2005 driven by the
growth in revenue and a focus on controlling costs.
Taxable-equivalent net interest income for 2005 increased
$34 million, or 5%, compared with 2004 primarily as a
result of higher loan balances funded mainly by higher
deposits. The impact of the deconsolidation of Market Street
effective October 17, 2005, the interest cost of funding the
potential tax exposure on the cross-border leasing portfolio,
and a refined method of accounting for loan origination fees
and costs partially offset these factors. Based on market
conditions, we expect a slower rate of loan growth in future
periods. We also expect growth in deposits to continue in
the near term.
The provision for credit losses was a $30 million credit in
2005 compared with a $5 million provision for 2004. The
negative provision for 2005 resulted primarily from a $53
million loan recovery in the second quarter of 2005. The
increase in nonperforming assets over prior year-end is
attributable primarily to an increase in nonaccrual asset-
based loans. Based on the assets we currently hold and
current business trends and activities, we believe that overall
asset quality will remain strong at least for the near term.
However, we anticipate that the provision for credit losses
will increase in future quarters.