PNC Bank 2005 Annual Report Download - page 47
Download and view the complete annual report
Please find page 47 of the 2005 PNC Bank annual report below. You can navigate through the pages in the report by either clicking on the pages listed below, or by using the keyword search tool below to find specific information within the annual report.-
 1
1 -
2
-
3
-
4
-
5
-
6
-
7
-
8
-
9
-
10
-
11
-
12
-
13
-
14
-
15
-
16
-
17
-
18
-
19
-
20
-
21
-
22
-
23
-
24
-
25
-
26
-
27
-
28
-
29
-
30
-
31
-
32
-
33
-
34
-
35
-
36
-
 37
37 -
 38
38 -
 39
39 -
 40
40 -
 41
41 -
 42
42 -
 43
43 -
 44
44 -
 45
45 -
 46
46 -
 47
47 -
 48
48 -
 49
49 -
 50
50 -
 51
51 -
 52
52 -
 53
53 -
 54
54 -
 55
55 -
 56
56 -
 57
57 -
58
-
59
-
60
-
61
-
62
-
63
-
64
-
65
-
66
-
67
-
68
-
69
-
70
-
71
-
72
-
73
-
74
-
75
-
76
-
77
-
78
-
79
-
80
-
81
-
82
-
83
-
84
-
85
-
86
-
87
-
88
-
89
-
90
-
91
-
92
-
93
-
94
-
95
-
96
-
97
-
98
-
99
-
100
-
101
-
102
-
103
-
104
-
105
-
106
-
107
-
108
-
109
-
110
-
111
-
112
-
113
-
114
-
115
-
116
-
117
-
118
-
119
-
120
-
121
-
122
-
123
-
124
-
125
-
126
-
127
-
128
-
129
-
130
-
131
-
132
-
133
-
134
-
135
-
136
-
137
-
138
-
139
-
140
-
141
-
142
-
143
-
144
-
145
-
146
-
147
-
148
-
149
-
150
-
151
-
152
-
153
-
154
-
155
-
156
-
157
-
158
-
159
-
160
-
161
-
162
-
163
-
164
-
165
-
166
-
167
-
168
-
169
-
170
-
171
-
172
-
173
-
174
-
175
-
176
-
177
-
178
-
179
-
180
-
181
-
182
-
183
-
184
-
185
-
186
-
187
-
188
-
189
-
190
-
191
-
192
-
193
-
194
-
195
-
196
-
197
-
198
-
199
-
200
-
201
-
202
-
203
-
204
-
205
-
206
-
207
-
208
-
209
-
210
-
211
-
212
-
213
-
214
-
215
-
216
-
217
-
218
-
219
-
220
-
221
-
222
-
223
-
224
-
225
-
226
-
227
-
228
-
229
-
230
-
231
-
232
-
233
-
234
-
235
-
236
-
237
-
238
-
239
-
240
-
241
-
242
-
243
-
244
-
245
-
246
-
247
-
248
-
249
-
250
-
251
-
252
-
253
-
254
-
255
-
256
-
257
-
258
-
259
-
260
-
261
-
262
-
263
-
264
-
265
-
266
-
267
-
268
-
269
-
270
-
271
-
272
-
273
-
274
-
275
-
276
-
277
-
278
-
279
-
280
-
281
-
282
-
283
-
284
-
285
-
286
-
287
-
288
-
289
-
290
-
291
-
292
-
293
-
294
-
295
-
296
-
297
-
298
-
299
-
300
 |
 |

47
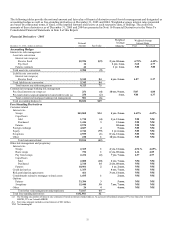
Our pool reserve methodology is sensitive to changes in key
risk parameters such as PDs, LGDs and EADs. In general, a
given change in any of the major risk parameters will have a
corresponding change in the pool reserve allocations for
non-impaired commercial loans. Our commercial loans are
the largest category of credits and are most sensitive to
changes in the key risk parameters and pool reserve loss
rates. To illustrate, if we increase the pool reserve loss rates
by 5% for all categories of non-impaired commercial loans,
then the aggregate of the allowance for loan and lease losses
and allowance for unfunded loan commitments and letters
of credit would increase by $29 million. Additionally, other
factors such as the rate of migration in the severity of
problem loans or changes in the maturity distribution of the
loans will contribute to the final pool reserve allocations.
We make consumer (including residential mortgage) loan
allocations at a total portfolio level by consumer product
line based on historical loss experience. We compute a four-
quarter average loss rate from net charge-offs for the prior
four quarters as a percentage of the average loans
outstanding in those quarters. We apply this loss rate to
loans outstanding at the end of the current period to
determine the consumer loan allocation.
We establish reserves to provide coverage for probable
losses not considered in the specific, pool and consumer
reserve methodologies, such as, but not limited to, industry
concentrations and conditions, credit quality trends, recent
loss experience in particular sectors of the portfolio,
experience, ability and depth of lending management,
changes in risk selection and underwriting standards and the
timing of available information. The amount of reserves for
these qualitative factors is assigned to loan categories and to
business segments based on the relative specific and pool
allocation amounts. Enhancements to the reserve
methodology in the third quarter of 2005 resulted in more
precise modeling of pool allocations and reduced the
amount of reserve allocated for qualitative factors. This
portion represented 9.9% of the total allowance and .12% of
total loans at December 31, 2005.
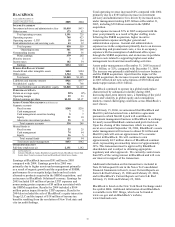
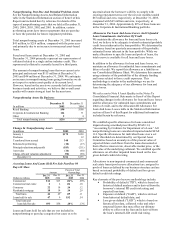
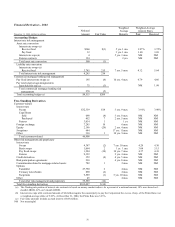
Charge-Offs And Recoveries
Net Percent of
Year ended December 31
Dollars in millions Charge-offs Recoveries
Charge-offs
(Recoveries)
Average
Loans
2005
Commercial (a) $52 $82
$(30) (.16)%
Commercial real estate 1 1
Consumer 45 15
30 .19
Residential mortgage 2
2 .03
Lease financing 29 1
28 .95
Total $129 $99
$30 .06
2004
Commercial (b) $113 $31
$82
.49%
Commercial real estate 2 1
1
.05
Consumer 43 12
31
.22
Residential mortgage 3 1
2
.05
Lease financing 5 6
(1)
(.03)
Total $166 $51
$115
.28
(a) Includes a $53 million loan recovery.
(b) During the first quarter of 2004, we changed our policy for
recognizing charge-offs on smaller nonperforming commercial loans.
This change resulted in the recognition of an additional $24 million of
gross charge-offs for the first quarter of 2004.
Apart from the impact of the items described in footnotes
(a) and (b) above, commercial net charge-offs declined $35
million in 2005 compared with the prior year primarily due
to an improvement in the overall credit quality of the
commercial loan portfolio. The increase in equipment lease
financing net charge-offs in 2005 compared with the prior
year reflected an additional charge-off in the fourth quarter
of 2005 related to a single leasing customer.
Aside from the impact of the $53 million loan recovery in
2005, increases in the provision for credit losses compared
with 2004 and the allowances for loan and lease losses and
unfunded loan commitments and letters of credit as of
December 31, 2005 reflected growth in loans and loan
commitments and additional provisions related to a leasing
customer. The provision includes amounts for probable
losses on loans and credit exposure related to unfunded loan
commitments and letters of credit.
We do not expect to sustain asset quality at its current level.
However, based on the assets we currently hold and current
business trends and activities, we believe that overall asset
quality will remain strong at least for the near term. This
outlook, combined with expected loan growth, may result in
an increase in the allowance for loan and lease losses in
future periods.
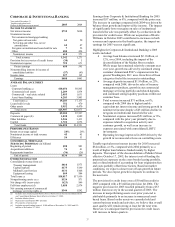
CREDIT-RELATED INSTRUMENTS
Credit Default Swaps
Credit default swaps provide, for a fee, an assumption by a
third party of a portion of the credit risk related to the
underlying financial instruments. We use the contracts to
mitigate credit risk associated with commercial lending
activities as well as proprietary derivative and convertible
bond trading. Credit default swaps are included in the Free-
Standing Derivatives table in the Financial Derivatives
section of this Risk Management discussion. We realized
minimal net gains in connection with credit default swaps
during 2005 and a net loss of $4.4 million in 2004.
Interest Rate Derivative Risk Participation Agreements
We enter into risk participation agreements to share credit
exposure with other financial counterparties related to
interest rate derivative contracts or take on credit exposure
to generate revenue. Risk participation agreements are
included in the Free-Standing Derivatives table in the
Financial Derivatives section of this Risk Management
discussion.
Agreements entered into prior to July 1, 2003 are considered
to be financial guarantees and, therefore, are not included in
the Financial Derivatives section of this Risk Management
discussion. Risk participation agreements entered into prior
to July 1, 2003 used by us to mitigate credit risk had a
notional amount of $3 million at December 31, 2005
compared with $36 million at December 31, 2004. Risk
participation agreements entered into in which we assumed
credit risk exposure had a total notional amount of $18
million at December 31, 2005 compared with $24 million at
December 31, 2004.