PNC Bank 2005 Annual Report Download - page 58
Download and view the complete annual report
Please find page 58 of the 2005 PNC Bank annual report below. You can navigate through the pages in the report by either clicking on the pages listed below, or by using the keyword search tool below to find specific information within the annual report.-
 1
1 -
2
-
3
-
4
-
5
-
6
-
7
-
8
-
9
-
10
-
11
-
12
-
13
-
14
-
15
-
16
-
17
-
18
-
19
-
20
-
21
-
22
-
23
-
24
-
25
-
26
-
27
-
28
-
29
-
30
-
31
-
32
-
33
-
34
-
35
-
36
-
37
-
38
-
39
-
40
-
41
-
42
-
43
-
44
-
45
-
46
-
47
-
 48
48 -
 49
49 -
 50
50 -
 51
51 -
 52
52 -
 53
53 -
 54
54 -
 55
55 -
 56
56 -
 57
57 -
 58
58 -
 59
59 -
 60
60 -
 61
61 -
 62
62 -
 63
63 -
 64
64 -
 65
65 -
 66
66 -
 67
67 -
 68
68 -
69
-
70
-
71
-
72
-
73
-
74
-
75
-
76
-
77
-
78
-
79
-
80
-
81
-
82
-
83
-
84
-
85
-
86
-
87
-
88
-
89
-
90
-
91
-
92
-
93
-
94
-
95
-
96
-
97
-
98
-
99
-
100
-
101
-
102
-
103
-
104
-
105
-
106
-
107
-
108
-
109
-
110
-
111
-
112
-
113
-
114
-
115
-
116
-
117
-
118
-
119
-
120
-
121
-
122
-
123
-
124
-
125
-
126
-
127
-
128
-
129
-
130
-
131
-
132
-
133
-
134
-
135
-
136
-
137
-
138
-
139
-
140
-
141
-
142
-
143
-
144
-
145
-
146
-
147
-
148
-
149
-
150
-
151
-
152
-
153
-
154
-
155
-
156
-
157
-
158
-
159
-
160
-
161
-
162
-
163
-
164
-
165
-
166
-
167
-
168
-
169
-
170
-
171
-
172
-
173
-
174
-
175
-
176
-
177
-
178
-
179
-
180
-
181
-
182
-
183
-
184
-
185
-
186
-
187
-
188
-
189
-
190
-
191
-
192
-
193
-
194
-
195
-
196
-
197
-
198
-
199
-
200
-
201
-
202
-
203
-
204
-
205
-
206
-
207
-
208
-
209
-
210
-
211
-
212
-
213
-
214
-
215
-
216
-
217
-
218
-
219
-
220
-
221
-
222
-
223
-
224
-
225
-
226
-
227
-
228
-
229
-
230
-
231
-
232
-
233
-
234
-
235
-
236
-
237
-
238
-
239
-
240
-
241
-
242
-
243
-
244
-
245
-
246
-
247
-
248
-
249
-
250
-
251
-
252
-
253
-
254
-
255
-
256
-
257
-
258
-
259
-
260
-
261
-
262
-
263
-
264
-
265
-
266
-
267
-
268
-
269
-
270
-
271
-
272
-
273
-
274
-
275
-
276
-
277
-
278
-
279
-
280
-
281
-
282
-
283
-
284
-
285
-
286
-
287
-
288
-
289
-
290
-
291
-
292
-
293
-
294
-
295
-
296
-
297
-
298
-
299
-
300
 |
 |
58
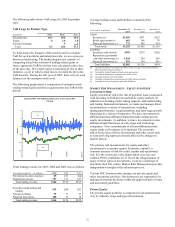
partially offset the decline in net gains on institutional loans
held for sale compared with the prior year.
Equity management net gains on portfolio investments totaled
$67 million for 2004 compared with net losses of $25 million
for 2003.
Net securities gains were $55 million in 2004 compared with
$116 million in 2003. Net securities gains for 2003 included
$25 million related to the liquidation that year of the three
entities formed in 2001 in the PAGIC transactions.
Noninterest revenue from trading activities totaled $113
million for 2004 and $127 million for 2003. We provide
additional information on our trading activities under Market
Risk Management – Trading Risk in the Risk Management
section of this Item 7.
Other noninterest income totaled $289 million for 2004, an
increase of $53 million or 22% compared with 2003. Other
noninterest income typically fluctuates from year to year
depending on the nature and magnitude of transactions
completed. Other noninterest income for 2004 included the
following:
• A $34 million pretax gain related to the sale of our
modified coinsurance contracts as described under
DIG B36 Impact on 2003 Results and 2004 Sale of
Modified Coinsurance Contracts below, and
• A $13 million pretax gain recognized during the
second quarter of 2004 in connection with
BlackRock’ s sale of its interest in Trepp LLC.
In addition to these items, the increase in other noninterest
income for 2004 compared with the prior year included the
recognition of $25 million of private equity dividends in 2004
and the comparative impact of $12 million related to the mid-
2003 adoption of FIN 46.
Partially offsetting the impact of these items on other
noninterest income was a $7 million decline in leasing revenue
resulting from the 2004 sale of our vehicle leasing.
DIG B36 IMPACT ON 2003 RESULTS AND 2004 SALE OF
MODIFIED COINSURANCE CONTRACTS
As required by the FASB, effective October 1, 2003 we
adopted the provisions of Derivatives Implementation Group
Statement 133 Implementation Issue No. B36, “Embedded
Derivatives: Modified Coinsurance Arrangements and Debt
Instruments That Incorporate Credit Risk Exposures That Are
Unrelated or Only Partially Related to the Creditworthiness of
the Obligor under Those Instruments” (“DIG B36”), for our
annuity coinsurance agreements. Our initial adoption of the
provisions of DIG B36 to existing coinsurance agreements as
of October 1, 2003 was reported in our Consolidated Income
Statement as the cumulative effect of an accounting change and
reduced both fourth quarter and full year 2003 net income by
$28 million, or $.10 per diluted share. Subsequent to initial
adoption, other noninterest income increased by $8 million in
the fourth quarter of 2003 as a result of DIG B36.
During the first quarter of 2004, we recognized a $34 million
pretax gain on the sale of our modified coinsurance contracts.
We continue to sell various annuity products from which we
earn commission income as further described under Product
Revenue in Item 7 of this Report.
Noninterest Expense
Total noninterest expense was $3.735 billion for 2004, an
increase of $259 million or 7% compared with $3.476 billion in
2003. The efficiency ratio was 68% for 2004 and 66% for
2003.
Noninterest expense for 2004 included the following:
• Pretax charges totaling $110 million, including $96
million recorded in the third quarter, associated with
the BlackRock LTIP;
• Costs totaling approximately $78 million resulting
from the United National acquisition, including
approximately $11 million of conversion-related and
other nonrecurring costs; and
• A $22 million reduction in the benefit of accretion
related to a discounted PFPC client contract liability
that ended during the second quarter of 2004.
In addition to these items, the increase in noninterest expense
for 2004 compared with 2003 included the impact of the
following items, which had no effect on 2004 consolidated net
income:
• An increase of $30 million related to the mid-2003
adoption of FIN 46, and
• An increase of $22 million in PFPC out-of-pocket and
pass-through expenses which are offset in noninterest
income.
Noninterest expense for 2003 included the impact of the
following items:
• Expenses totaling $120 million recognized in
connection with a subsidiary’ s second quarter 2003
agreement with the DOJ, including $5 million of
related legal and consulting costs;
• Costs totaling $29 million paid in connection with our
2003 liquidation of the three entities formed in 2001
in the PAGIC transactions. The impact of these costs
was mostly offset by related net securities gains
included in noninterest income;
• Distributions on capital securities totaling $28 million;
• Facilities charges totaling $25 million related to leased
space consistent with the requirements of SFAS 146,
“Accounting for Costs Associated with Exit or
Disposal Activities;” and
• A $25 million benefit from the vehicle leasing
settlement during the fourth quarter of 2003.
Apart from the items described above, noninterest expense for
2004 increased $174 million compared with 2003. Higher
expenses in 2004 were primarily attributable to higher sales-
based compensation, stock-based incentive compensation and
marketing costs. These charges more than offset the benefit of