PNC Bank 2005 Annual Report Download - page 60
Download and view the complete annual report
Please find page 60 of the 2005 PNC Bank annual report below. You can navigate through the pages in the report by either clicking on the pages listed below, or by using the keyword search tool below to find specific information within the annual report.
60
Regulatory capital ratios at December 31, 2004 were 7.6% for
leverage, 9.0% for tier 1 risk-based and 13.0% for total risk-
based capital. The regulatory capital ratios were 8.2% for
leverage, 9.5% for tier 1 risk-based and 13.8% for total risk-
based capital at December 31, 2003.
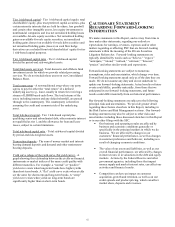
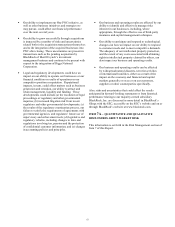
Glossary of Terms
Accounting/administration net fund assets - Net domestic and
foreign fund investment assets for which we provide
accounting and administration services. We do not include
these assets on our Consolidated Balance Sheet.
Adjusted average total assets - Primarily comprised of total
average quarterly (or annual) assets plus (less) unrealized
losses (gains) on available-for-sale debt securities, less
goodwill and certain other intangible assets.
Annualized - Adjusted to reflect a full year of activity.
Assets under management - Assets over which we have sole or
shared investment authority for our customers/clients. We do
not include these assets on our Consolidated Balance Sheet.
Basis point - One hundredth of a percentage point.
Charge-off - Process of removing a loan or portion of a loan
from a bank's balance sheet because the loan is considered
uncollectible. A charge-off is also recorded when a loan is
transferred to held for sale and the loan’ s market value is less
than its carrying amount.
Common shareholders’ equity to total assets - Common
shareholders' equity divided by total assets. Common
shareholders' equity equals total shareholders' equity less the
liquidation value of preferred stock.
Credit derivatives - Contractual agreements that provide
protection against a credit event of one or more referenced
credits. The nature of a credit event is established by the
protection buyer and protection seller at the inception of a
transaction, and such events include bankruptcy, insolvency
and failure to meet payment obligations when due. The buyer
of the credit derivative pays a periodic fee in return for a
payment by the protection seller upon the occurrence, if any, of
a credit event.
Custody assets - All investment assets held on behalf of clients
under safekeeping arrangements. We do not include these
assets on our Consolidated Balance Sheet. Investment assets
held in custody at other institutions on our behalf are included
in the appropriate asset categories on the Consolidated Balance
Sheet as if physically held by us.
Derivatives - Financial contracts whose value is derived from
publicly traded securities, interest rates, currency exchange
rates or market indices. Derivatives cover a wide assortment of
financial contracts, including forward contracts, futures,
options and swaps.
Duration of equity - An estimate of the rate sensitivity of a
firm’ s economic value of equity. A negative duration of equity
is associated with asset sensitivity (i.e., positioned for rising
interest rates), while a positive value implies liability
sensitivity (i.e., vulnerable to rising rates). For example, if the
duration is +1.5 years, the economic value of equity declines by
1.5% for each 100 basis point increase in interest rates.
Earning assets - Assets that generate income, which include:
federal funds sold; resale agreements; other short-term
investments, including trading securities; loans held for sale;
loans, net of unearned income; securities; and certain other
assets.
Economic capital - Represents the amount of resources that a
business segment should hold to guard against potentially large
losses that could cause insolvency. It is based on a
measurement of economic risk, as opposed to risk as defined
by regulatory bodies. The economic capital measurement
process involves converting a risk distribution to the capital
that is required to support the risk, consistent with an
institution’ s target credit rating. As such, economic risk serves
as a “common currency” of risk that allows an institution to
compare different risks on a similar basis.
Economic value of equity (“EVE”) - The present value of the
expected cash flows of our existing assets less the present value
of the expected cash flows of our existing liabilities, plus the
present value of the net cash flows of our existing off-balance
sheet positions.
Effective duration - A measurement, expressed in years, that,
when multiplied by a change in interest rates, would
approximate the percentage change in value of on- and off-
balance sheet positions.
Efficiency - Noninterest expense divided by the sum of net
interest income and noninterest income.
Foreign exchange contracts - Contracts that provide for the
future receipt and delivery of foreign currency at previously
agreed-upon terms.
Funds transfer pricing - A management accounting
methodology designed to recognize the net interest income
effects of sources and uses of funds provided by the assets and
liabilities of business segments. These balances are assigned
funding rates that represent the interest cost for us to
raise/invest funds with similar maturity and repricing
structures, using the least-cost funding sources available.


