PNC Bank 2005 Annual Report Download - page 113
Download and view the complete annual report
Please find page 113 of the 2005 PNC Bank annual report below. You can navigate through the pages in the report by either clicking on the pages listed below, or by using the keyword search tool below to find specific information within the annual report.-
 1
1 -
2
-
3
-
4
-
5
-
6
-
7
-
8
-
9
-
10
-
11
-
12
-
13
-
14
-
15
-
16
-
17
-
18
-
19
-
20
-
21
-
22
-
23
-
24
-
25
-
26
-
27
-
28
-
29
-
30
-
31
-
32
-
33
-
34
-
35
-
36
-
37
-
38
-
39
-
40
-
41
-
42
-
43
-
44
-
45
-
46
-
47
-
48
-
49
-
50
-
51
-
52
-
53
-
54
-
55
-
56
-
57
-
58
-
59
-
60
-
61
-
62
-
63
-
64
-
65
-
66
-
67
-
68
-
69
-
70
-
71
-
72
-
73
-
74
-
75
-
76
-
77
-
78
-
79
-
80
-
81
-
82
-
83
-
84
-
85
-
86
-
87
-
88
-
89
-
90
-
91
-
92
-
93
-
94
-
95
-
96
-
97
-
98
-
99
-
100
-
101
-
102
-
 103
103 -
 104
104 -
 105
105 -
 106
106 -
 107
107 -
 108
108 -
 109
109 -
 110
110 -
 111
111 -
 112
112 -
 113
113 -
 114
114 -
 115
115 -
 116
116 -
 117
117 -
 118
118 -
 119
119 -
 120
120 -
 121
121 -
 122
122 -
 123
123 -
124
-
125
-
126
-
127
-
128
-
129
-
130
-
131
-
132
-
133
-
134
-
135
-
136
-
137
-
138
-
139
-
140
-
141
-
142
-
143
-
144
-
145
-
146
-
147
-
148
-
149
-
150
-
151
-
152
-
153
-
154
-
155
-
156
-
157
-
158
-
159
-
160
-
161
-
162
-
163
-
164
-
165
-
166
-
167
-
168
-
169
-
170
-
171
-
172
-
173
-
174
-
175
-
176
-
177
-
178
-
179
-
180
-
181
-
182
-
183
-
184
-
185
-
186
-
187
-
188
-
189
-
190
-
191
-
192
-
193
-
194
-
195
-
196
-
197
-
198
-
199
-
200
-
201
-
202
-
203
-
204
-
205
-
206
-
207
-
208
-
209
-
210
-
211
-
212
-
213
-
214
-
215
-
216
-
217
-
218
-
219
-
220
-
221
-
222
-
223
-
224
-
225
-
226
-
227
-
228
-
229
-
230
-
231
-
232
-
233
-
234
-
235
-
236
-
237
-
238
-
239
-
240
-
241
-
242
-
243
-
244
-
245
-
246
-
247
-
248
-
249
-
250
-
251
-
252
-
253
-
254
-
255
-
256
-
257
-
258
-
259
-
260
-
261
-
262
-
263
-
264
-
265
-
266
-
267
-
268
-
269
-
270
-
271
-
272
-
273
-
274
-
275
-
276
-
277
-
278
-
279
-
280
-
281
-
282
-
283
-
284
-
285
-
286
-
287
-
288
-
289
-
290
-
291
-
292
-
293
-
294
-
295
-
296
-
297
-
298
-
299
-
300
 |
 |

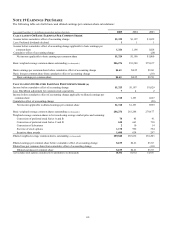
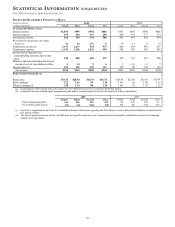
STATISTICAL INFORMATION (UNAUDITED)
THE PNC FINANCIAL SERVICES GROUP, INC.
113
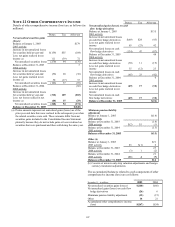
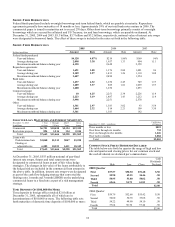
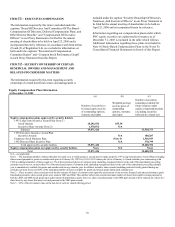
SELECTED QUARTERLY FINANCIAL DATA
2005 2004 Dollars in millions,
except per share data Fourth Third Second First Fourth Third Second First
SUMMARY OF OPERATIONS
Interest income $1,034 $995 $901 $804 $743 $685 $658 $666
Interest expense 479 436 367 298 240 194 177 172
Net interest income 555 559 534 506 503 491 481 494
Provision for (recoveries of) credit
losses (a) 24 16 (27) 8 19 13 8 12
Noninterest income (b) 1,151 1,113 925 973 904 838 910 911
Noninterest expense 1,142 1,156 1,036 999 949 981 910 895
Income before minority and
noncontrolling interests and income
taxes 540 500 450 472 439 335 473 498
Minority and noncontrolling interests in
income (loss) of consolidated entities 4 14 9 6 5 (13) 11 7
Income taxes (c) 181 152 159 112 127 90 158 163
Net income $355 $334 $282 $354 $307 $258 $304 $328
PER COMMON SHARE DATA
Book value $29.21 $28.54 $28.35 $26.78 $26.41 $25.89 $25.01
$25.61
Basic earnings 1.22 1.16 .99 1.26 1.09 .92 1.08 1.16
Diluted earnings (d) 1.20 1.14 .98 1.24 1.08 .91 1.07 1.15
(a) Second quarter 2005 amount reflects the impact of a $53 million loan recovery recognized during that quarter.
(b) Noninterest income included equity management gains and net securities gains (losses) in each quarter as follows (in millions):
2005 2004
Fourth Third Second First Fourth Third Second First
Equity management gains $16 $36 $12 $32 $9 $16 $35 $7
Net securities gains (losses) $(4)
$(2)
$(26)
$(9) $10 $16 $14 $15
(c) See Note 2 Acquisitions in the Notes To Consolidated Financial Statements regarding the $45 million reversal of deferred tax liabilities recognized in the
first quarter of 2005.
(d) The sum of quarterly amounts for the year 2005 does not equal the respective year’ s amount because the quarterly calculations are based on a changing
number of average shares.