PNC Bank 2005 Annual Report Download - page 65
Download and view the complete annual report
Please find page 65 of the 2005 PNC Bank annual report below. You can navigate through the pages in the report by either clicking on the pages listed below, or by using the keyword search tool below to find specific information within the annual report.-
 1
1 -
2
-
3
-
4
-
5
-
6
-
7
-
8
-
9
-
10
-
11
-
12
-
13
-
14
-
15
-
16
-
17
-
18
-
19
-
20
-
21
-
22
-
23
-
24
-
25
-
26
-
27
-
28
-
29
-
30
-
31
-
32
-
33
-
34
-
35
-
36
-
37
-
38
-
39
-
40
-
41
-
42
-
43
-
44
-
45
-
46
-
47
-
48
-
49
-
50
-
51
-
52
-
53
-
54
-
 55
55 -
 56
56 -
 57
57 -
 58
58 -
 59
59 -
 60
60 -
 61
61 -
 62
62 -
 63
63 -
 64
64 -
 65
65 -
 66
66 -
 67
67 -
 68
68 -
 69
69 -
 70
70 -
 71
71 -
 72
72 -
 73
73 -
 74
74 -
 75
75 -
76
-
77
-
78
-
79
-
80
-
81
-
82
-
83
-
84
-
85
-
86
-
87
-
88
-
89
-
90
-
91
-
92
-
93
-
94
-
95
-
96
-
97
-
98
-
99
-
100
-
101
-
102
-
103
-
104
-
105
-
106
-
107
-
108
-
109
-
110
-
111
-
112
-
113
-
114
-
115
-
116
-
117
-
118
-
119
-
120
-
121
-
122
-
123
-
124
-
125
-
126
-
127
-
128
-
129
-
130
-
131
-
132
-
133
-
134
-
135
-
136
-
137
-
138
-
139
-
140
-
141
-
142
-
143
-
144
-
145
-
146
-
147
-
148
-
149
-
150
-
151
-
152
-
153
-
154
-
155
-
156
-
157
-
158
-
159
-
160
-
161
-
162
-
163
-
164
-
165
-
166
-
167
-
168
-
169
-
170
-
171
-
172
-
173
-
174
-
175
-
176
-
177
-
178
-
179
-
180
-
181
-
182
-
183
-
184
-
185
-
186
-
187
-
188
-
189
-
190
-
191
-
192
-
193
-
194
-
195
-
196
-
197
-
198
-
199
-
200
-
201
-
202
-
203
-
204
-
205
-
206
-
207
-
208
-
209
-
210
-
211
-
212
-
213
-
214
-
215
-
216
-
217
-
218
-
219
-
220
-
221
-
222
-
223
-
224
-
225
-
226
-
227
-
228
-
229
-
230
-
231
-
232
-
233
-
234
-
235
-
236
-
237
-
238
-
239
-
240
-
241
-
242
-
243
-
244
-
245
-
246
-
247
-
248
-
249
-
250
-
251
-
252
-
253
-
254
-
255
-
256
-
257
-
258
-
259
-
260
-
261
-
262
-
263
-
264
-
265
-
266
-
267
-
268
-
269
-
270
-
271
-
272
-
273
-
274
-
275
-
276
-
277
-
278
-
279
-
280
-
281
-
282
-
283
-
284
-
285
-
286
-
287
-
288
-
289
-
290
-
291
-
292
-
293
-
294
-
295
-
296
-
297
-
298
-
299
-
300
 |
 |

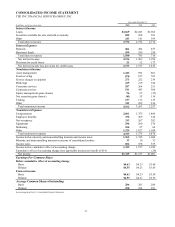
CONSOLIDATED INCOME STATEMENT
THE PNC FINANCIAL SERVICES GROUP, INC.
In millions, except per share data 2005 2004 2003
Interest Income
Loans $2,669 $2,043 $1,962
Securities available for sale and held to maturity 822 568 581
Other 243 141 169
Total interest income 3,734 2,752 2,712
Interest Expense
Deposits 981 484 457
Borrowed funds 599 299 259
Total interest expense 1,580 783 716
Net interest income 2,154 1,969 1,996
Provision for credit losses 21 52 177
Net interest income less provision for credit losses 2,133 1,917 1,819
Noninterest Income
Asset management 1,443 994 861
Fund servicing 870 817 762
Service charges on deposits 273 252 239
Brokerage 225 219 184
Consumer services 287 264 251
Corporate services 511 493 506
Equity management gains (losses) 96 67 (25)
Net securities gains (losses) (41) 55 116
Trading 157 113 127
Other 341 289 236
Total noninterest income 4,162 3,563 3,257
Noninterest Expense
Compensation 2,061 1,755 1,480
Employee benefits 332 309 324
Net occupancy 313 267 282
Equipment 296 290 276
Marketing 106 87 64
Other 1,225 1,027 1,050
Total noninterest expense 4,333 3,735 3,476
Income before minority and noncontrolling interests and income taxes 1,962 1,745 1,600
Minority and noncontrolling interests in income of consolidated entities 33 10 32
Income taxes 604 538 539
Income before cumulative effect of accounting change 1,325 1,197 1,029
Cumulative effect of accounting change (less applicable income tax benefit of $14) (28)
Net income
$1,325
$1,197
$1,001
Earnings Per Common Share
Before cumulative effect of accounting change
Basic $4.63 $4.25 $3.68
Diluted $4.55 $4.21 $3.65
From net income
Basic $4.63 $4.25 $3.58
Diluted $4.55 $4.21 $3.55
Average Common Shares Outstanding
Basic 286 281 280
Diluted
290
284
281
See accompanying Notes To Consolidated Financial Statements.
65
Year ended December 31