PNC Bank 2005 Annual Report Download - page 59
Download and view the complete annual report
Please find page 59 of the 2005 PNC Bank annual report below. You can navigate through the pages in the report by either clicking on the pages listed below, or by using the keyword search tool below to find specific information within the annual report. 59
lower pension expense in the comparison and an $87 million
incremental benefit in 2004 from efficiency initiatives.
Effective Tax Rate
Our effective tax rate for 2004 was 30.8% compared with
33.7% for 2003. The decrease in the effective tax rate in 2004
was primarily attributable to the following:
• A reduced state and local tax expense due to tax
benefits of $18 million recorded in connection with
New York state and city audits, principally associated
with BlackRock, and
• A $14 million reduction in income tax expense
following our determination in the third quarter of
2004 that we no longer required an income tax reserve
related to bank-owned life insurance.
CONSOLIDATED BALANCE SHEET REVIEW
Loans
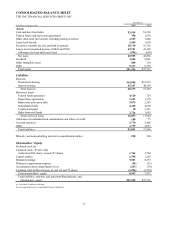
Loans increased $7.2 billion, or 20%, as of December 31, 2004
compared with December 31, 2003. The increase in total loans
reflected the following:
• Home equity loans increased $2.9 billion, reflecting
organic growth and the purchase of approximately
$660 million of home equity loans in early 2004,
• Demand for commercial loans grew during the year,
reflected in the $2.4 billion increase in this loan
category, and
• Automobile and other consumer loans combined
increased $.8 billion.
The favorable impact of these factors on our loan balances was
partially offset by the effect of the sale of the vehicle leasing
portfolio in 2004. We added $1.9 billion of loans with the
United National acquisition in 2004, as reflected in various
loan categories.
Securities
Total securities at December 31, 2004 were $16.8 billion
compared with $15.7 billion at December 31, 2003. Securities
represented 21% of total assets at December 31, 2004
compared with 23% at December 31, 2003. The increase in
total securities compared with December 31, 2003 was
primarily due to increases in US Treasury and government
agencies and mortgage-backed securities, partially offset by
declines in commercial mortgage-backed and asset- backed
securities.
At December 31, 2004, the securities available for sale balance
included a net unrealized loss of $102 million, which represented
the difference between fair value and amortized cost. The
comparable amount at December 31, 2003 was a net unrealized
gain of $4 million. The impact on bond prices of increases in
interest rates during 2004 was reflected in the net unrealized loss
position at December 31, 2004. The expected weighted-average
life of securities available for sale was 2 years and 8 months at
December 31, 2004 compared with 2 years and 11 months at
December 31, 2003.
Loans Held For Sale
Education loans held for sale totaled $1.1 billion at December
31, 2004, and $1.0 billion at December 31, 2003 and
represented the majority of our loans held for sale at each date.
Loans held for sale remaining from our 2001 institutional
lending repositioning totaled $5 million at December 31, 2004
and $70 million at December 31, 2003.
Asset Quality
Nonperforming assets were $175 million at December 31,
2004, a decline of $153 million from December 31, 2003. The
decline in nonperforming assets reflected the significant
improvement in overall asset quality during 2004. The ratio of
nonperforming assets to total loans, loans held for sale and
foreclosed assets was .39% at December 31, 2004 compared
with .87% at December 31, 2003. The allowance for loan and
lease losses was $607 million and represented 1.40% of total
loans and 424% of nonperforming loans at December 31, 2004.
The comparable amounts were $632 million, 1.74% and 238%,
respectively, at December 31, 2003.
Funding Sources
Total funding sources were $65.2 billion at December 31, 2004
and $56.7 billion at December 31, 2003, an increase of $8.5
billion. This increase reflected the impact of the following
2004 developments:
• Our United National acquisition,
• An 8% increase in checking relationships,
• An increase in time deposits in foreign offices that
reflected our increased use of Eurodollar deposits as a
short-term funding mechanism,
• The issuance of $500 million of 18 month, floating
rate bank notes in September 2004 and $500 million
of 5.25% subordinated bank notes due 2017 in
December 2004, and
• An increase in other short-term borrowings to fund
asset growth.
These increases were partially offset by debt maturities of $2.4
billion during 2004.
Shareholders’ Equity
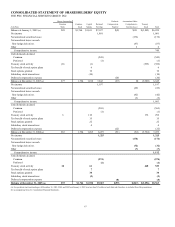
The increase of $.8 billion, to $7.5 billion, in total
shareholders’ equity at December 31, 2004 compared with the
prior year-end was primarily attributable to $360 million of
common stock issued as part of the January 2004 United
National acquisition and a higher retention of earnings through
2004 in anticipation of the SSRM acquisition by BlackRock
and the pending acquisition of Riggs. Partially offsetting this
increase was a decline in the fair value of securities available
for sale and cash flow hedge derivatives due to the impact of
rising interest rates that began during the second quarter of
2004 and continued into the latter half of the year. These fair
value changes are captured in the accumulated other
comprehensive income (loss) component of shareholders’
equity.


