PNC Bank 2005 Annual Report Download - page 97
Download and view the complete annual report
Please find page 97 of the 2005 PNC Bank annual report below. You can navigate through the pages in the report by either clicking on the pages listed below, or by using the keyword search tool below to find specific information within the annual report.-
 1
1 -
2
-
3
-
4
-
5
-
6
-
7
-
8
-
9
-
10
-
11
-
12
-
13
-
14
-
15
-
16
-
17
-
18
-
19
-
20
-
21
-
22
-
23
-
24
-
25
-
26
-
27
-
28
-
29
-
30
-
31
-
32
-
33
-
34
-
35
-
36
-
37
-
38
-
39
-
40
-
41
-
42
-
43
-
44
-
45
-
46
-
47
-
48
-
49
-
50
-
51
-
52
-
53
-
54
-
55
-
56
-
57
-
58
-
59
-
60
-
61
-
62
-
63
-
64
-
65
-
66
-
67
-
68
-
69
-
70
-
71
-
72
-
73
-
74
-
75
-
76
-
77
-
78
-
79
-
80
-
81
-
82
-
83
-
84
-
85
-
86
-
 87
87 -
 88
88 -
 89
89 -
 90
90 -
 91
91 -
 92
92 -
 93
93 -
 94
94 -
 95
95 -
 96
96 -
 97
97 -
 98
98 -
 99
99 -
 100
100 -
 101
101 -
 102
102 -
 103
103 -
 104
104 -
 105
105 -
 106
106 -
 107
107 -
108
-
109
-
110
-
111
-
112
-
113
-
114
-
115
-
116
-
117
-
118
-
119
-
120
-
121
-
122
-
123
-
124
-
125
-
126
-
127
-
128
-
129
-
130
-
131
-
132
-
133
-
134
-
135
-
136
-
137
-
138
-
139
-
140
-
141
-
142
-
143
-
144
-
145
-
146
-
147
-
148
-
149
-
150
-
151
-
152
-
153
-
154
-
155
-
156
-
157
-
158
-
159
-
160
-
161
-
162
-
163
-
164
-
165
-
166
-
167
-
168
-
169
-
170
-
171
-
172
-
173
-
174
-
175
-
176
-
177
-
178
-
179
-
180
-
181
-
182
-
183
-
184
-
185
-
186
-
187
-
188
-
189
-
190
-
191
-
192
-
193
-
194
-
195
-
196
-
197
-
198
-
199
-
200
-
201
-
202
-
203
-
204
-
205
-
206
-
207
-
208
-
209
-
210
-
211
-
212
-
213
-
214
-
215
-
216
-
217
-
218
-
219
-
220
-
221
-
222
-
223
-
224
-
225
-
226
-
227
-
228
-
229
-
230
-
231
-
232
-
233
-
234
-
235
-
236
-
237
-
238
-
239
-
240
-
241
-
242
-
243
-
244
-
245
-
246
-
247
-
248
-
249
-
250
-
251
-
252
-
253
-
254
-
255
-
256
-
257
-
258
-
259
-
260
-
261
-
262
-
263
-
264
-
265
-
266
-
267
-
268
-
269
-
270
-
271
-
272
-
273
-
274
-
275
-
276
-
277
-
278
-
279
-
280
-
281
-
282
-
283
-
284
-
285
-
286
-
287
-
288
-
289
-
290
-
291
-
292
-
293
-
294
-
295
-
296
-
297
-
298
-
299
-
300
 |
 |

97
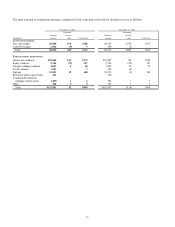
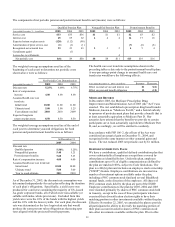
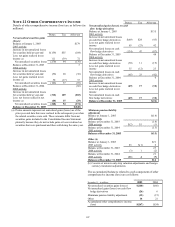
PENSION PLAN ASSETS
Assets related to our qualified pension plan (the “Plan”) are
held in trust (the “Trust”). The trustee is PNC Bank, N.A.
The Trust is exempt from tax pursuant to section 501(a) of
the Internal Revenue Code (the “Code”). The Plan is
qualified under section 401(a) of the Code. Plan assets
consist primarily of listed domestic and international equity
securities and US government, agency, and corporate debt
securities and, in 2005, real estate investments. Plan assets
do not include common or preferred stock or any debt of
PNC.
The Pension Plan Administrative Committee (the
“Committee”) adopted the current Pension Plan Investment
Policy Statement, including the updated target allocations
and allowable ranges shown below, on November 29, 2005.
The long-term investment strategy for pension plan assets is
to:
• Meet present and future benefit obligations to all
participants and beneficiaries,
• Cover reasonable expenses incurred to
provide such benefits, including expense
incurred in the administration of the Trust
and the Plan,
• Provide sufficient liquidity to meet benefit and
expense payment requirements on a timely basis,
and
• Provide a total return that, over the long term,
ma ximizes the ratio of trust assets to liabilities by
maximizing investment return, at an appropriate
level of risk.
The Plan’ s specific investment objective is to meet or
exceed the investment policy benchmark over the long term.
The investment policy benchmark compares actual
performance to a weighted market index, and measures the
contribution of active investment management and policy
implementation. This investment objective is expected to be
achieved over the long term (one or more market cycles)
and is measured over rolling five-year periods. Total return
calculations are time -weighted and are net of investment-
related fees and expenses.
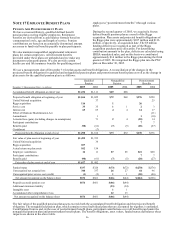
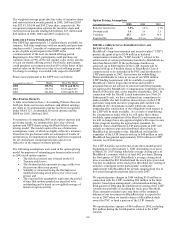
The asset allocations for the Trust at the end of 2005 and
2004, and the target allocation for 2006, by asset category,
are as follows:
Target
Allocation
Allowable
Range
Percentage of Plan Assets
at December 31
2006 2005 2004
Asset Category
Domestic
Equity
35%
32-38% 39.0% 39.0%
International
Equity
20%
17-23% 19.6% 20.6%
Private
Equity 5% 0-8% .9% .6%
Total Equity 60% 59.5% 60.2%
Domestic
Fixed Income 30% 27-33% 30.7% 29.7%
High Yield
Fixed Income 5% 0-8% 6.7% 9.7%
Total Fixed
Income 35% 37.4% 39.4%
Real Estate 5% 0-8% 2.5%
Other 0% 0-1 % .6% .4%
Total 100% 100% 100%
The slight overweight in domestic equity at year-end 2005
and 2004 is attributable to the targeted allocation in Private
Equity, which continues to be committed but which is
funded over time as suitable opportunities for private equity
investment are identified and as calls for funding are made.
The Investment Policy Statement provides that, from time to
time, domestic equity may serve as a proxy (substitute) for
private equity. Additionally, target allocation changes,
which were effective November 29, 2005, included reducing
the High Yield Fixed Income allocation from 10% to 5%
and creating a new Real Estate allocation of 5%. It is
anticipated that this transition will be completed during
2006 as suitable investment opportunities become available.
We believe that, over the long term, asset allocation is the
single greatest determinant of risk. Asset allocation will
deviate from the target percentages due to market
movement, cash flows, and investment manager
performance. Material deviations from the asset allocation
targets can alter the expected return and risk of the Trust.
On the other hand, frequent rebalancing to the asset
allocation targets may result in significant transaction costs,
which can impair the Trust’ s ability to meet its investment
objective. Accordingly, the Trust portfolio is periodically
rebalanced to maintain asset allocation within the target
ranges described above.
In addition to being diversified across asset classes, the
Trust is diversified within each asset class. Secondary
diversification provides a reasonable basis for the
expectation that no single security or class of securities will
have a disproportionate impact on the total risk and return of
the Trust.