PNC Bank 2005 Annual Report Download - page 34
Download and view the complete annual report
Please find page 34 of the 2005 PNC Bank annual report below. You can navigate through the pages in the report by either clicking on the pages listed below, or by using the keyword search tool below to find specific information within the annual report.-
 1
1 -
2
-
3
-
4
-
5
-
6
-
7
-
8
-
9
-
10
-
11
-
12
-
13
-
14
-
15
-
16
-
17
-
18
-
19
-
20
-
21
-
22
-
23
-
 24
24 -
 25
25 -
 26
26 -
 27
27 -
 28
28 -
 29
29 -
 30
30 -
 31
31 -
 32
32 -
 33
33 -
 34
34 -
 35
35 -
 36
36 -
 37
37 -
 38
38 -
 39
39 -
 40
40 -
 41
41 -
 42
42 -
 43
43 -
 44
44 -
45
-
46
-
47
-
48
-
49
-
50
-
51
-
52
-
53
-
54
-
55
-
56
-
57
-
58
-
59
-
60
-
61
-
62
-
63
-
64
-
65
-
66
-
67
-
68
-
69
-
70
-
71
-
72
-
73
-
74
-
75
-
76
-
77
-
78
-
79
-
80
-
81
-
82
-
83
-
84
-
85
-
86
-
87
-
88
-
89
-
90
-
91
-
92
-
93
-
94
-
95
-
96
-
97
-
98
-
99
-
100
-
101
-
102
-
103
-
104
-
105
-
106
-
107
-
108
-
109
-
110
-
111
-
112
-
113
-
114
-
115
-
116
-
117
-
118
-
119
-
120
-
121
-
122
-
123
-
124
-
125
-
126
-
127
-
128
-
129
-
130
-
131
-
132
-
133
-
134
-
135
-
136
-
137
-
138
-
139
-
140
-
141
-
142
-
143
-
144
-
145
-
146
-
147
-
148
-
149
-
150
-
151
-
152
-
153
-
154
-
155
-
156
-
157
-
158
-
159
-
160
-
161
-
162
-
163
-
164
-
165
-
166
-
167
-
168
-
169
-
170
-
171
-
172
-
173
-
174
-
175
-
176
-
177
-
178
-
179
-
180
-
181
-
182
-
183
-
184
-
185
-
186
-
187
-
188
-
189
-
190
-
191
-
192
-
193
-
194
-
195
-
196
-
197
-
198
-
199
-
200
-
201
-
202
-
203
-
204
-
205
-
206
-
207
-
208
-
209
-
210
-
211
-
212
-
213
-
214
-
215
-
216
-
217
-
218
-
219
-
220
-
221
-
222
-
223
-
224
-
225
-
226
-
227
-
228
-
229
-
230
-
231
-
232
-
233
-
234
-
235
-
236
-
237
-
238
-
239
-
240
-
241
-
242
-
243
-
244
-
245
-
246
-
247
-
248
-
249
-
250
-
251
-
252
-
253
-
254
-
255
-
256
-
257
-
258
-
259
-
260
-
261
-
262
-
263
-
264
-
265
-
266
-
267
-
268
-
269
-
270
-
271
-
272
-
273
-
274
-
275
-
276
-
277
-
278
-
279
-
280
-
281
-
282
-
283
-
284
-
285
-
286
-
287
-
288
-
289
-
290
-
291
-
292
-
293
-
294
-
295
-
296
-
297
-
298
-
299
-
300
 |
 |

34
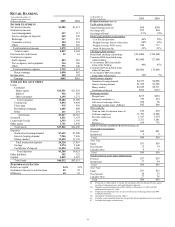
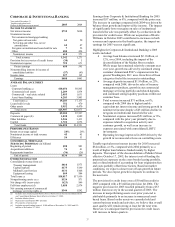
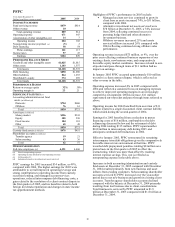
RETAIL BANKING
Year ended December 31
Taxable-equivalent basis
Dollars in millions
2005 2004
INCOME STATEMENT
Net interest income $1,582 $1,471
Noninterest income
Asset management 337 317
Service charges on deposits 265 243
Brokerage 217 215
Consumer services 254 238
Other 202 210
Total noninterest income 1,275 1,223
Total revenue 2,857 2,694
Provision for credit losses 52 61
Noninterest expense
Staff expense 823 819
Net occupancy and equipment 316 306
Other 576 546
Total noninterest expense 1,715 1,671
Pretax earnings 1,090 962
Income taxes 408 352
Earnings $682 $610
AVERAGE BALANCE SHEET
Loans
Consumer
Home equity $13,351 $11,625
Indirect 936 843
Other consumer 1,195 1,231
Total consumer 15,482 13,699
Commercial 5,094 4,468
Floor plan 975 970
Residential mortgage 1,405 888
Other 261 291
Total loans 23,217 20,316
Goodwill 1,331 1,155
Loans held for sale 1,553 1,183
Other assets 1,761 1,842
Total assets $27,862 $24,496
Deposits
Noninterest-bearing demand $7,639 $7,040
Interest-bearing demand 7,946 7,636
Money market 13,635 13,143
Total transaction deposits 29,220 27,819
Savings 2,574 2,640
Certificates of deposit 11,494 8,966
Total deposits 43,288 39,425
Other liabilities 392 521
Capital 2,852 2,687
Total funds $46,532 $42,633
PERFORMANCE RATIOS
Return on capital 24%
23%
Noninterest income to total revenue 45 45
Efficiency 60 62
At December 31
Dollars in millions 2005 2004
OTHER INFORMATION (a)
Credit-related statistics:
Nonperforming assets (b) $90 $100
Net charge-offs $53 $64
Net charge-off ratio .23% .32%
Home equity portfolio credit statistics:
% of first lien positions 46% 50%
Weighted average loan-to-value ratios 68% 69%
Weighted average FICO scores 728 717
Loans 90 days past due .21% .21%
Checking-related statistics:
Retail Bank checking relationships 1,934,000 1,762,000
Consumer DDA households using
online banking 855,000 717,000
% of consumer DDA households
using online banking 49% 45%
Consumer DDA households using
online bill payment 205,000 113,000
% of consumer DDA households
using online bill payment 12% 7%
Small business deposits:
Noninterest-bearing demand $4,353 $4,006
Interest -bearing demand $1,560 $1,605
Money market $2,849 $2,711
Certificates of deposit $412 $312
Brokerage statistics:
Margin loans $217 $254
Financial consultants (c) 779 814
Full service brokerage offices 100 98
Brokerage account assets (billions) $42 $40
Other statistics:
Gains on sales of education loans (d) $19 $30
Full-time employees 11,703 11,800
Part time employees 1,413 1,154
ATMs 3,721 3,581
Branches (e) 839 776
ASSETS UNDER ADMINISTRATION (billions) (f)
Assets under management
Personal $40 $41
Institutional 9 9
Total $49 $50
Asset Type
Equity $31 $30
Fixed income 12 14
Liquidity/other 6 6
Total $49 $50
Nondiscretionary assets under administration
Personal $27 $29
Institutional 57 64
Total $84 $93
Asset Type
Equity $33 $32
Fixed income 24 33
Liquidity/other 27 28
Total $84 $93
(a) Presented as of December 31 except for net charge-offs, net charge-off ratio, gains
on sales of education loans, and small business deposits.
(b) Includes nonperforming loans of $81 million at December 31, 2005 and $89
million at December 31, 2004.
(c) Financial consultants provide services in full service brokerage offices and PNC
traditional branches.
(d) Included in “Noninterest income-Other.”
(e) Excludes certain satellite branches that provide limited products and service hours.
(f) Excludes brokerage account assets.