PNC Bank 2005 Annual Report Download - page 75
Download and view the complete annual report
Please find page 75 of the 2005 PNC Bank annual report below. You can navigate through the pages in the report by either clicking on the pages listed below, or by using the keyword search tool below to find specific information within the annual report.-
 1
1 -
2
-
3
-
4
-
5
-
6
-
7
-
8
-
9
-
10
-
11
-
12
-
13
-
14
-
15
-
16
-
17
-
18
-
19
-
20
-
21
-
22
-
23
-
24
-
25
-
26
-
27
-
28
-
29
-
30
-
31
-
32
-
33
-
34
-
35
-
36
-
37
-
38
-
39
-
40
-
41
-
42
-
43
-
44
-
45
-
46
-
47
-
48
-
49
-
50
-
51
-
52
-
53
-
54
-
55
-
56
-
57
-
58
-
59
-
60
-
61
-
62
-
63
-
64
-
 65
65 -
 66
66 -
 67
67 -
 68
68 -
 69
69 -
 70
70 -
 71
71 -
 72
72 -
 73
73 -
 74
74 -
 75
75 -
 76
76 -
 77
77 -
 78
78 -
 79
79 -
 80
80 -
 81
81 -
 82
82 -
 83
83 -
 84
84 -
 85
85 -
86
-
87
-
88
-
89
-
90
-
91
-
92
-
93
-
94
-
95
-
96
-
97
-
98
-
99
-
100
-
101
-
102
-
103
-
104
-
105
-
106
-
107
-
108
-
109
-
110
-
111
-
112
-
113
-
114
-
115
-
116
-
117
-
118
-
119
-
120
-
121
-
122
-
123
-
124
-
125
-
126
-
127
-
128
-
129
-
130
-
131
-
132
-
133
-
134
-
135
-
136
-
137
-
138
-
139
-
140
-
141
-
142
-
143
-
144
-
145
-
146
-
147
-
148
-
149
-
150
-
151
-
152
-
153
-
154
-
155
-
156
-
157
-
158
-
159
-
160
-
161
-
162
-
163
-
164
-
165
-
166
-
167
-
168
-
169
-
170
-
171
-
172
-
173
-
174
-
175
-
176
-
177
-
178
-
179
-
180
-
181
-
182
-
183
-
184
-
185
-
186
-
187
-
188
-
189
-
190
-
191
-
192
-
193
-
194
-
195
-
196
-
197
-
198
-
199
-
200
-
201
-
202
-
203
-
204
-
205
-
206
-
207
-
208
-
209
-
210
-
211
-
212
-
213
-
214
-
215
-
216
-
217
-
218
-
219
-
220
-
221
-
222
-
223
-
224
-
225
-
226
-
227
-
228
-
229
-
230
-
231
-
232
-
233
-
234
-
235
-
236
-
237
-
238
-
239
-
240
-
241
-
242
-
243
-
244
-
245
-
246
-
247
-
248
-
249
-
250
-
251
-
252
-
253
-
254
-
255
-
256
-
257
-
258
-
259
-
260
-
261
-
262
-
263
-
264
-
265
-
266
-
267
-
268
-
269
-
270
-
271
-
272
-
273
-
274
-
275
-
276
-
277
-
278
-
279
-
280
-
281
-
282
-
283
-
284
-
285
-
286
-
287
-
288
-
289
-
290
-
291
-
292
-
293
-
294
-
295
-
296
-
297
-
298
-
299
-
300
 |
 |

75
We did not terminate any cash flow hedges in 2005, 2004 or
2003 due to a determination that a forecasted transaction was
no longer likely to occur.
We occasionally purchase or originate financial instruments
that contain an embedded derivative. At the inception of the
transaction we assess if economic characteristics of the
embedded derivative are clearly and closely related to the
economic characteristics of the financial instrument (host
contract), whether the financial instrument that embodies
both the embedded derivative and the host contract is
measured at fair value with changes in fair value reported in
earnings, and whether a separate instrument with the same
terms as the embedded instrument would not meet the
definition of a derivative. If the embedded derivative does
not meet these three conditions, the embedded derivative
would qualify as a derivative instrument and be recorded
apart from the host contract and carried at fair value with
changes recorded in current earnings.
We enter into commitments to make loans whereby the
interest rate on the loan is set prior to funding (interest rate
lock commitments). We also enter into commitments to
purchase mortgage loans (purchase commitments). Both
interest rate lock commitments and purchase commitments
on mortgage loans that will be held for resale are accounted
for as free-standing derivatives. Interest rate lock
commitments and purchase commitments that are considered
to be derivatives are recorded at fair value in other assets or
other liabilities. Fair value of interest rate lock commitments
and purchase commitments is determined as the change in
value that occurs after the inception of the commitment
considering the projected security price, fees collected from
the borrower and costs to originate, adjusted for anticipated
fallout risk. We recognize the gain or loss from the change in
fair value of these derivatives in trading noninterest income.
INCOME TAXES
We account for income taxes under the asset and liability
method. Deferred tax assets and liabilities are determined
based on differences between the financial reporting and tax
bases of assets and liabilities and are measured using the
enacted tax rates and laws that we expect will apply at the
time when we believe the differences will reverse.
EARNINGS PER COMMON SHARE
We calculate basic earnings per common share by dividing
net income adjusted for preferred stock dividends declared by
the weighted-average number of shares of common stock
outstanding.
Diluted earnings per common share is based on net income
available to common stockholders. We increase the
weighted-average number of shares of common stock
outstanding by the assumed conversion of outstanding
convertible preferred stock and debentures from the
beginning of the year or date of issuance, if later, and the
number of shares of common stock that would be issued
assuming the exercise of stock options and the issuance of
incentive shares using the treasury stock method. These
adjustments to the weighted-average number of shares of
common stock outstanding are made only when we expect
such adjustments to dilute earnings per common share.
STOCK-BASED COMPENSATION
Our stock-based employee compensation plans are described
in Note 18 Stock-Based Compensation Plans.
Effective January 1, 2003, we adopted the fair value
recognition provisions of SFAS 123, “Accounting for Stock-
Based Compensation,” as amended by SFAS 148,
“Accounting for Stock-Based Compensation -Transition and
Disclosure,” prospectively to all employee awards granted,
modified or settled after January 1, 2003. We did not restate
results for prior years upon our adoption of SFAS 123. Since
we adopted SFAS 123 prospectively, the cost related to stock-
based employee compensation included in net income for
2005, 2004 and 2003 is less than what we would have
recognized if we had applied the fair value based method to
all awards since the original effective date of the standard.
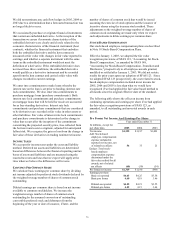
The following table shows the effect on income from
continuing operations and earnings per share if we had applied
the fair value recognition provisions of SFAS 123, as
amended, to all outstanding and unvested awards in each
period.
Pro Forma Net Income And Earnings Per Share
Year ended December 31
In millions, except for
per share data
2005
2004
2003
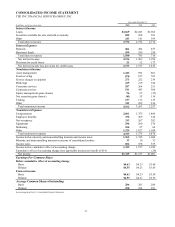
Net income $1,325 $1,197 $1,001
Add: Stock-based
employee compensation
expense included in
reported net income, net
of related tax effects 54 33 21
Deduct: Total stock-
based employee
compensation expense
determined under the
fair value method for all
awards, net of related
tax effects (60)
(50) (54)
Pro forma net income $1,319 $1,180 $968
Earnings per share
Basic-as reported $4.63 $4.25 $3.58
Basic-pro forma 4.60 4.19 3.46
Diluted-as reported $4.55 $4.21 $3.55
Diluted-pro forma 4.52 4.15 3.44