PNC Bank 2005 Annual Report Download - page 26
Download and view the complete annual report
Please find page 26 of the 2005 PNC Bank annual report below. You can navigate through the pages in the report by either clicking on the pages listed below, or by using the keyword search tool below to find specific information within the annual report.-
 1
1 -
2
-
3
-
4
-
5
-
6
-
7
-
8
-
9
-
10
-
11
-
12
-
13
-
14
-
15
-
 16
16 -
 17
17 -
 18
18 -
 19
19 -
 20
20 -
 21
21 -
 22
22 -
 23
23 -
 24
24 -
 25
25 -
 26
26 -
 27
27 -
 28
28 -
 29
29 -
 30
30 -
 31
31 -
 32
32 -
 33
33 -
 34
34 -
 35
35 -
 36
36 -
37
-
38
-
39
-
40
-
41
-
42
-
43
-
44
-
45
-
46
-
47
-
48
-
49
-
50
-
51
-
52
-
53
-
54
-
55
-
56
-
57
-
58
-
59
-
60
-
61
-
62
-
63
-
64
-
65
-
66
-
67
-
68
-
69
-
70
-
71
-
72
-
73
-
74
-
75
-
76
-
77
-
78
-
79
-
80
-
81
-
82
-
83
-
84
-
85
-
86
-
87
-
88
-
89
-
90
-
91
-
92
-
93
-
94
-
95
-
96
-
97
-
98
-
99
-
100
-
101
-
102
-
103
-
104
-
105
-
106
-
107
-
108
-
109
-
110
-
111
-
112
-
113
-
114
-
115
-
116
-
117
-
118
-
119
-
120
-
121
-
122
-
123
-
124
-
125
-
126
-
127
-
128
-
129
-
130
-
131
-
132
-
133
-
134
-
135
-
136
-
137
-
138
-
139
-
140
-
141
-
142
-
143
-
144
-
145
-
146
-
147
-
148
-
149
-
150
-
151
-
152
-
153
-
154
-
155
-
156
-
157
-
158
-
159
-
160
-
161
-
162
-
163
-
164
-
165
-
166
-
167
-
168
-
169
-
170
-
171
-
172
-
173
-
174
-
175
-
176
-
177
-
178
-
179
-
180
-
181
-
182
-
183
-
184
-
185
-
186
-
187
-
188
-
189
-
190
-
191
-
192
-
193
-
194
-
195
-
196
-
197
-
198
-
199
-
200
-
201
-
202
-
203
-
204
-
205
-
206
-
207
-
208
-
209
-
210
-
211
-
212
-
213
-
214
-
215
-
216
-
217
-
218
-
219
-
220
-
221
-
222
-
223
-
224
-
225
-
226
-
227
-
228
-
229
-
230
-
231
-
232
-
233
-
234
-
235
-
236
-
237
-
238
-
239
-
240
-
241
-
242
-
243
-
244
-
245
-
246
-
247
-
248
-
249
-
250
-
251
-
252
-
253
-
254
-
255
-
256
-
257
-
258
-
259
-
260
-
261
-
262
-
263
-
264
-
265
-
266
-
267
-
268
-
269
-
270
-
271
-
272
-
273
-
274
-
275
-
276
-
277
-
278
-
279
-
280
-
281
-
282
-
283
-
284
-
285
-
286
-
287
-
288
-
289
-
290
-
291
-
292
-
293
-
294
-
295
-
296
-
297
-
298
-
299
-
300
 |
 |

26
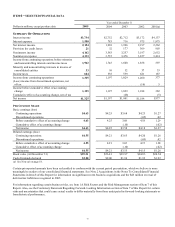
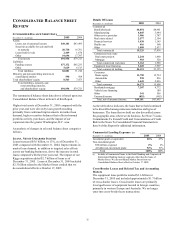
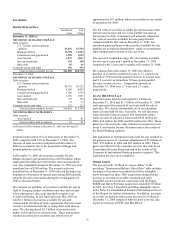
CONSOLIDATED BALANCE SHEET
REVIEW
SUMMARIZED BALANCE SHEET DATA
December 31 - in millions 2005 2004
Assets
Loans, net of unearned income $49,101 $43,495
Securities available for sale and held
to maturity 20,710 16,761
Loans held for sale 2,449 1,670
Other 19,694 17,797
Total assets $91,954 $79,723
Liabilities
Funding sources $77,172 $65,233
Other 5,629 6,513
Total liabilities 82,801 71,746
Minority and noncontrolling interests in
consolidated entities 590 504
Total shareholders' equity 8,563 7,473
Total liabilities, minority and
noncontrolling interests,
and shareholders' equity $91,954 $79,723
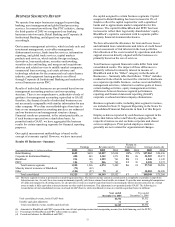
The summarized balance sheet data above is based upon our
Consolidated Balance Sheet in Item 8 of this Report.
Higher total assets at December 31, 2005 compared with the
prior year-end were driven by loan growth resulting
primarily from continued improvements in market loan
demand, higher securities balances that reflected normal
portfolio activity, purchases, and the impact of our
expansion into the greater Washington, D.C. area.
An analysis of changes in selected balance sheet categories
follows.
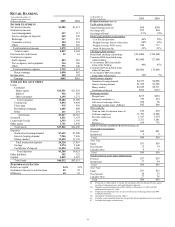
LOANS , NET OF UNEARNED INCOME
Loans increased $5.6 billion, or 13%, as of December 31,
2005 compared with December 31, 2004. Improvements in
market loan demand, in addition to targeted sales efforts
across our banking businesses, drove the increase in total
loans compared with the prior year-end. The impact of our
Riggs acquisition added $2.7 billion of loans as of
December 31, 2005. Loans at December 31, 2004 included
$2.3 billion related to the Market Street conduit that we
deconsolidated effective October 17, 2005.
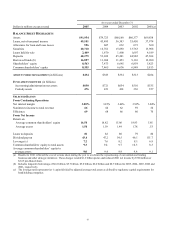
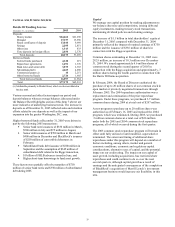
Details Of Loans
December 31 - in millions 2005 2004
Commercial
Retail/wholesale $4,854 $4,961
Manufacturing 4,045 3,944
Other service providers 1,986 1,787
Real estate related 2,577 2,104
Financial services 1,438 1,145
Health care 616 560
Other 3,809 2,937
Total commercial 19,325 17,438
Commercial real estate
Real estate projects 2,244 1,460
Mortgage 918 520
Total commercial real estate 3,162 1,980
Equipment lease financing 3,628 3,907
Total commercial lending 26,115 23,325
Consumer
Home equity 13,790 12,734
Automobile 938 836
Other 1,445 2,036
Total consumer 16,173 15,606
Residential mortgage 7,307 4,772
Vehicle lease financing 189
Other 341 505
Unearned income (835) (902)
Total, net of unearned income $49,101 $43,495
As the table above indicates, the loans that we hold continued
to be diversified among numerous industries and types of
businesses. The loans that we hold are also diversified across
the geographic areas where we do business. See Note 7 Loans,
Commitments To Extend Credit and Concentrations of Credit
Risk in the Notes To Consolidated Financial Statements in
Item 8 of this Report for additional information.
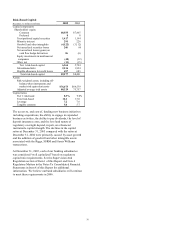
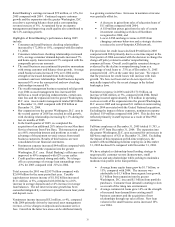
Commercial Lending Exposure (a)
Decemb er 31 - in millions 2005 2004
Investment grade or equivalent 46%
47%
Non-investment grade
$50 million or greater 2%
2%
All other non-investment grade 52%
51%
Total 100%
100%
(a) Includes all commercial loans in the Retail Banking and Corporate &
Institutional Banking business segments other than the loans of
Market Street. We deconsolidated Market Street from our
Consolidated Balance Sheet effective October 17, 2005.
Cross-Border Leases and Related Tax and Accounting
Matters
The equipment lease portfolio totaled $3.6 billion at
December 31, 2005 and included approximately $1.7 billion
of cross-border leases. Cross-border leases are primarily
leveraged leases of equipment located in foreign countries,
primarily in western Europe and Australia. We no longer
enter into cross-border lease transactions.