PNC Bank 2005 Annual Report Download - page 46
Download and view the complete annual report
Please find page 46 of the 2005 PNC Bank annual report below. You can navigate through the pages in the report by either clicking on the pages listed below, or by using the keyword search tool below to find specific information within the annual report.-
 1
1 -
2
-
3
-
4
-
5
-
6
-
7
-
8
-
9
-
10
-
11
-
12
-
13
-
14
-
15
-
16
-
17
-
18
-
19
-
20
-
21
-
22
-
23
-
24
-
25
-
26
-
27
-
28
-
29
-
30
-
31
-
32
-
33
-
34
-
35
-
 36
36 -
 37
37 -
 38
38 -
 39
39 -
 40
40 -
 41
41 -
 42
42 -
 43
43 -
 44
44 -
 45
45 -
 46
46 -
 47
47 -
 48
48 -
 49
49 -
 50
50 -
 51
51 -
 52
52 -
 53
53 -
 54
54 -
 55
55 -
 56
56 -
57
-
58
-
59
-
60
-
61
-
62
-
63
-
64
-
65
-
66
-
67
-
68
-
69
-
70
-
71
-
72
-
73
-
74
-
75
-
76
-
77
-
78
-
79
-
80
-
81
-
82
-
83
-
84
-
85
-
86
-
87
-
88
-
89
-
90
-
91
-
92
-
93
-
94
-
95
-
96
-
97
-
98
-
99
-
100
-
101
-
102
-
103
-
104
-
105
-
106
-
107
-
108
-
109
-
110
-
111
-
112
-
113
-
114
-
115
-
116
-
117
-
118
-
119
-
120
-
121
-
122
-
123
-
124
-
125
-
126
-
127
-
128
-
129
-
130
-
131
-
132
-
133
-
134
-
135
-
136
-
137
-
138
-
139
-
140
-
141
-
142
-
143
-
144
-
145
-
146
-
147
-
148
-
149
-
150
-
151
-
152
-
153
-
154
-
155
-
156
-
157
-
158
-
159
-
160
-
161
-
162
-
163
-
164
-
165
-
166
-
167
-
168
-
169
-
170
-
171
-
172
-
173
-
174
-
175
-
176
-
177
-
178
-
179
-
180
-
181
-
182
-
183
-
184
-
185
-
186
-
187
-
188
-
189
-
190
-
191
-
192
-
193
-
194
-
195
-
196
-
197
-
198
-
199
-
200
-
201
-
202
-
203
-
204
-
205
-
206
-
207
-
208
-
209
-
210
-
211
-
212
-
213
-
214
-
215
-
216
-
217
-
218
-
219
-
220
-
221
-
222
-
223
-
224
-
225
-
226
-
227
-
228
-
229
-
230
-
231
-
232
-
233
-
234
-
235
-
236
-
237
-
238
-
239
-
240
-
241
-
242
-
243
-
244
-
245
-
246
-
247
-
248
-
249
-
250
-
251
-
252
-
253
-
254
-
255
-
256
-
257
-
258
-
259
-
260
-
261
-
262
-
263
-
264
-
265
-
266
-
267
-
268
-
269
-
270
-
271
-
272
-
273
-
274
-
275
-
276
-
277
-
278
-
279
-
280
-
281
-
282
-
283
-
284
-
285
-
286
-
287
-
288
-
289
-
290
-
291
-
292
-
293
-
294
-
295
-
296
-
297
-
298
-
299
-
300
 |
 |

46
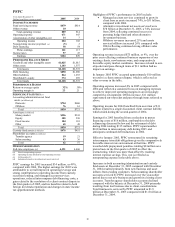
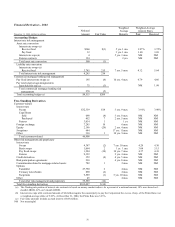
Nonperforming, Past Due And Potential Problem Assets
See the Nonperforming Assets And Related Information
table in the Statistical Information section of Item 8 of this
Report and included here by reference for details of the
types of nonperforming assets that we held at December 31,
2005, 2004, 2003, 2002 and 2001. In addition, certain
performing assets have interest payments that are past due
or have the potential for future repayment problems.
Total nonperforming assets at December 31, 2005 increased
$41 million, to $216 million, compared with the prior year-
end primarily due to an increase in nonaccrual asset-based
loans.
Foreclosed lease assets at December 31, 2005 and
December 31, 2004 primarily represent our repossession of
collateral related to a single airline industry credit. This
repossessed collateral is currently leased to a third party.
The amount of nonperforming loans that was current as to
principal and interest was $115 million at December 31,
2005 and $44 million at December 31, 2004. We anticipate
an increase in nonperforming loans going forward as we do
not expect to sustain asset quality at its current level.
However, based on the assets we currently hold and current
business trends and activities, we believe that overall asset
quality will remain strong at least for the near term.
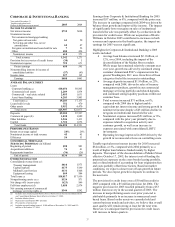
Nonperforming Assets By Business
December 31 December 31
In millions 2005 2004
Retail Banking $90 $100
Corporate & Institutional Banking 124 71
Other 2 4
Total nonperforming assets $216 $175
Change In Nonperforming Assets
In millions 2005 2004
January 1 $175 $328
Purchases 12
Transferred from accrual 340 213
Returned to performing (10) (17)
Principal reductions and payoffs (183) (211)
Asset sales (16) (60)
Charge-offs and valuation adjustments (90) (90)
December 31 $216 $175
Accruing Loans And Loans Held For Sale Past Due 90
Days Or More
Amount
Percent of Total
Outstandings
Dollars in millions
Dec. 31
2005
Dec. 31
2004
Dec. 31
2005
Dec. 31
2004
Commercial $12 $15 .06% .09%
Commercial real estate 2 2 .06 .10
Consumer 22 18 .14 .12
Residential mortgage 10 14 .14 .29
Total loans 46 49 .09 .11
Loans held for sale 47 9 1.92 .54
Total loans and
loans held for sale $93 $58
.18% .13%
Loans and loans held for sale that are not included in
nonperforming or past due categories but cause us to be
uncertain about the borrower’ s ability to comply with
existing repayment terms over the next six months totaled
$67 million and zero, respectively, at December 31, 2005,
compared with $65 million and zero, respectively, at
December 31, 2004. Approximately 89% of these loans are
in the Corporate & Institutional Banking portfolio.
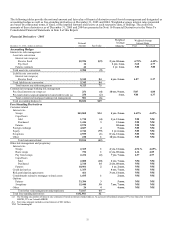
Allowances For Loan And Lease Losses And Unfunded
Loan Commitments And Letters Of Credit
We maintain the allowance for loan and lease losses at a
level we believe to be adequate to absorb estimated probable
credit losses inherent in the loan portfolio. We determine the
allowance based on quarterly assessments of the probable
estimated losses inherent in the loan portfolio. While we
make allocations to specific loans and pools of loans, the
total reserve is available for all loan and lease losses.
In addition to the allowance for loan and lease losses, we
maintain an allowance for unfunded loan commitments and
letters of credit. We report this allowance as a liability on
our Consolidated Balance Sheet. We determine this amount
using estimates of the probability of the ultimate funding
and losses related to those credit exposures. This
methodology is similar to the methodology we use for
determining the adequacy of our allowance for loan and
lease losses.
We refer you to Note 8 Asset Quality in the Notes To
Consolidated Financial Statements in Item 8 of this Report
regarding changes in the allowance for loan and lease losses
and the allowance for unfunded loan commitments and
letters of credit, and to the Allocation Of Allowance For
Loan And Lease Losses table in the Statistical Information
section of Item 8 of this Report for additional information
included herein by reference.
We establish specific allowances for loans considered
impaired using a method prescribed by SFAS 114,
“Accounting by Creditors for Impairment of a Loan.” All
nonperforming loans are considered impaired under SFAS
114. Specific allowances for individual loans over a set
dollar threshold are determined by our Special Asset
Committee based on an analysis of the present value of
expected future cash flows from the loans discounted at
their effective interest rate, observable market price, or the
fair value of the underlying collateral. We establish specific
allowance on all other impaired loans based on the loss
given default credit risk rating.
Allocations to non-impaired commercial and commercial
real estate loans (pool reserve allocations) are assigned to
pools of loans as defined by our business structure and are
based on internal probability of default and loss given
default credit risk ratings.
Key elements of the pool reserve methodology include:
• Probability of default (“PD”), which is based on
historical default analyses and is derived from the
borrower’ s internal PD credit risk rating and
expected loan term;
• Exposure at default (“EAD”), which is derived
from historical default data; and
• Loss given default (“LGD”), which is based on
his torical loss data, collateral value and other
structural factors that may affect our ultimate
ability to collect on the loan and is derived from
the loan’ s internal LGD credit risk rating.