PNC Bank 2005 Annual Report Download - page 103
Download and view the complete annual report
Please find page 103 of the 2005 PNC Bank annual report below. You can navigate through the pages in the report by either clicking on the pages listed below, or by using the keyword search tool below to find specific information within the annual report.-
 1
1 -
2
-
3
-
4
-
5
-
6
-
7
-
8
-
9
-
10
-
11
-
12
-
13
-
14
-
15
-
16
-
17
-
18
-
19
-
20
-
21
-
22
-
23
-
24
-
25
-
26
-
27
-
28
-
29
-
30
-
31
-
32
-
33
-
34
-
35
-
36
-
37
-
38
-
39
-
40
-
41
-
42
-
43
-
44
-
45
-
46
-
47
-
48
-
49
-
50
-
51
-
52
-
53
-
54
-
55
-
56
-
57
-
58
-
59
-
60
-
61
-
62
-
63
-
64
-
65
-
66
-
67
-
68
-
69
-
70
-
71
-
72
-
73
-
74
-
75
-
76
-
77
-
78
-
79
-
80
-
81
-
82
-
83
-
84
-
85
-
86
-
87
-
88
-
89
-
90
-
91
-
92
-
 93
93 -
 94
94 -
 95
95 -
 96
96 -
 97
97 -
 98
98 -
 99
99 -
 100
100 -
 101
101 -
 102
102 -
 103
103 -
 104
104 -
 105
105 -
 106
106 -
 107
107 -
 108
108 -
 109
109 -
 110
110 -
 111
111 -
 112
112 -
 113
113 -
114
-
115
-
116
-
117
-
118
-
119
-
120
-
121
-
122
-
123
-
124
-
125
-
126
-
127
-
128
-
129
-
130
-
131
-
132
-
133
-
134
-
135
-
136
-
137
-
138
-
139
-
140
-
141
-
142
-
143
-
144
-
145
-
146
-
147
-
148
-
149
-
150
-
151
-
152
-
153
-
154
-
155
-
156
-
157
-
158
-
159
-
160
-
161
-
162
-
163
-
164
-
165
-
166
-
167
-
168
-
169
-
170
-
171
-
172
-
173
-
174
-
175
-
176
-
177
-
178
-
179
-
180
-
181
-
182
-
183
-
184
-
185
-
186
-
187
-
188
-
189
-
190
-
191
-
192
-
193
-
194
-
195
-
196
-
197
-
198
-
199
-
200
-
201
-
202
-
203
-
204
-
205
-
206
-
207
-
208
-
209
-
210
-
211
-
212
-
213
-
214
-
215
-
216
-
217
-
218
-
219
-
220
-
221
-
222
-
223
-
224
-
225
-
226
-
227
-
228
-
229
-
230
-
231
-
232
-
233
-
234
-
235
-
236
-
237
-
238
-
239
-
240
-
241
-
242
-
243
-
244
-
245
-
246
-
247
-
248
-
249
-
250
-
251
-
252
-
253
-
254
-
255
-
256
-
257
-
258
-
259
-
260
-
261
-
262
-
263
-
264
-
265
-
266
-
267
-
268
-
269
-
270
-
271
-
272
-
273
-
274
-
275
-
276
-
277
-
278
-
279
-
280
-
281
-
282
-
283
-
284
-
285
-
286
-
287
-
288
-
289
-
290
-
291
-
292
-
293
-
294
-
295
-
296
-
297
-
298
-
299
-
300
 |
 |

103
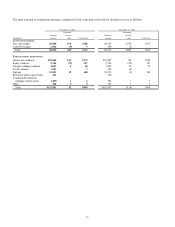
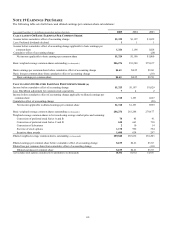
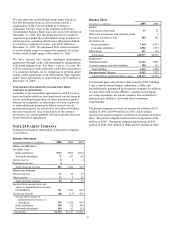
NOTE 19 EARNINGS PER SHARE
The following table sets forth basic and diluted earnings per common share calculations:
Year ended December 31
-
in millions, except share and per share data
2005
2004
2003
CALCULATION OF BASIC EARNINGS PER COMMON SHARE
Income before cumulative effect of accounting change $1,325 $1,197 $1,029
Less: Preferred dividends declared 1 1 1
Income before cumulative effect of accounting change applicable to basic earnings per
common share 1,324 1,196 1,028
Cumulative effect of accounting change (28)
Net income applicable to basic earnings per common share $1,324 $1,196 $1,000
Basic weighted-average common shares outstanding (in thousands) 286,276 281,248 279,677
Basic earnings per common share before cumulative effect of accounting change $4.63 $4.25 $3.68
Basic loss per common share from cumulative effect of accounting change (.10)
Basic earnings per common share $4.63 $4.25 $3.58
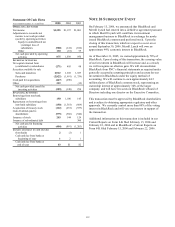
CALCULATION OF DILUTED EARNINGS PER COMMON SHARE (a)
Income before cumulative effect of accounting change $1,325 $1,197 $1,029
Less: BlackRock adjustment for common stock equivalents 7 4 2
Income before cumulative effect of accounting change applicable to diluted earnings per
common share 1,318 1,193 1,027
Cumulative effect of accounting change (28)
Net income applicable to diluted earnings per common share $1,318 $1,193 $999
Basic weighted-average common shares outstanding (in thousands) 286,276 281,248 279,677
Weighted-average common shares to be issued using average market price and assuming:
Conversion of preferred stock Series A and B 78 85 91
Conversion of preferred stock Series C and D 618 663 730
Conversion of debentures 2 10 14
Exercise of stock options 1,178 992 394
Incentive share awards 1,688 634 297
Diluted weighted-average common shares outstanding (in thousands) 289,840 283,632 281,203
Diluted earnings per common share before cumulative effect of accounting change $4.55 $4.21 $3.65
Diluted loss per common share from cumulative effect of accounting change (.10)
Diluted earnings per common share $4.55 $4.21 $3.55
(a) Excludes stock options considered to be anti-dilutive (in thousands) 10,532 10,762 14,756