PNC Bank 2005 Annual Report Download - page 23
Download and view the complete annual report
Please find page 23 of the 2005 PNC Bank annual report below. You can navigate through the pages in the report by either clicking on the pages listed below, or by using the keyword search tool below to find specific information within the annual report.-
 1
1 -
2
-
3
-
4
-
5
-
6
-
7
-
8
-
9
-
10
-
11
-
12
-
 13
13 -
 14
14 -
 15
15 -
 16
16 -
 17
17 -
 18
18 -
 19
19 -
 20
20 -
 21
21 -
 22
22 -
 23
23 -
 24
24 -
 25
25 -
 26
26 -
 27
27 -
 28
28 -
 29
29 -
 30
30 -
 31
31 -
 32
32 -
 33
33 -
34
-
35
-
36
-
37
-
38
-
39
-
40
-
41
-
42
-
43
-
44
-
45
-
46
-
47
-
48
-
49
-
50
-
51
-
52
-
53
-
54
-
55
-
56
-
57
-
58
-
59
-
60
-
61
-
62
-
63
-
64
-
65
-
66
-
67
-
68
-
69
-
70
-
71
-
72
-
73
-
74
-
75
-
76
-
77
-
78
-
79
-
80
-
81
-
82
-
83
-
84
-
85
-
86
-
87
-
88
-
89
-
90
-
91
-
92
-
93
-
94
-
95
-
96
-
97
-
98
-
99
-
100
-
101
-
102
-
103
-
104
-
105
-
106
-
107
-
108
-
109
-
110
-
111
-
112
-
113
-
114
-
115
-
116
-
117
-
118
-
119
-
120
-
121
-
122
-
123
-
124
-
125
-
126
-
127
-
128
-
129
-
130
-
131
-
132
-
133
-
134
-
135
-
136
-
137
-
138
-
139
-
140
-
141
-
142
-
143
-
144
-
145
-
146
-
147
-
148
-
149
-
150
-
151
-
152
-
153
-
154
-
155
-
156
-
157
-
158
-
159
-
160
-
161
-
162
-
163
-
164
-
165
-
166
-
167
-
168
-
169
-
170
-
171
-
172
-
173
-
174
-
175
-
176
-
177
-
178
-
179
-
180
-
181
-
182
-
183
-
184
-
185
-
186
-
187
-
188
-
189
-
190
-
191
-
192
-
193
-
194
-
195
-
196
-
197
-
198
-
199
-
200
-
201
-
202
-
203
-
204
-
205
-
206
-
207
-
208
-
209
-
210
-
211
-
212
-
213
-
214
-
215
-
216
-
217
-
218
-
219
-
220
-
221
-
222
-
223
-
224
-
225
-
226
-
227
-
228
-
229
-
230
-
231
-
232
-
233
-
234
-
235
-
236
-
237
-
238
-
239
-
240
-
241
-
242
-
243
-
244
-
245
-
246
-
247
-
248
-
249
-
250
-
251
-
252
-
253
-
254
-
255
-
256
-
257
-
258
-
259
-
260
-
261
-
262
-
263
-
264
-
265
-
266
-
267
-
268
-
269
-
270
-
271
-
272
-
273
-
274
-
275
-
276
-
277
-
278
-
279
-
280
-
281
-
282
-
283
-
284
-
285
-
286
-
287
-
288
-
289
-
290
-
291
-
292
-
293
-
294
-
295
-
296
-
297
-
298
-
299
-
300
 |
 |

23
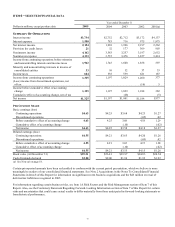
CONSOLIDATED INCOME
STATEMENT REVIEW
NET INTEREST INCOME - OVERVIEW
Changes in net interest income and margin result from the
interaction of the volume and composition of interest-
earning assets and related yields, interest-bearing liabilities
and related rates paid, and noninterest-bearing sources.
See Statistical Information – Analysis of Year-To-Year
Changes in Net Interest Income and Average Consolidated
Balance Sheet and Net Interest Analysis in Item 8 of this
Report for additional information.
NET INTEREST INCOME - GAAP RECONCILIATION
The interest income earned on certain assets is completely
or partially exempt from federal income tax. As such, these
tax-exempt instruments typically yield lower returns than a
taxable investment. To provide more meaningful
comparisons of yields and margins for all earning assets, we
also provide net interest income on a taxable -equivalent
basis by increasing the interest income earned on tax-
exempt assets to make it fully equivalent to interest income
on other taxable investments. This adjustment is not
permitted under GAAP.
A reconciliation of net interest income as reported in the
Consolidated Income Statement (GAAP basis) to net
interest income on a taxable-equivalent basis follows (in
millions):
For the year ended December 31,
2005 2004 2003
Net interest income, GAAP
basis $2,154 $1,969 $1,996
Taxable-equivalent adjustment 33 20 10
Net interest income, taxable-
equivalent basis $2,187 $1,989 $2,006
Taxable-equivalent net interest income increased $198
million in 2005 compared with 2004 due to strong growth in
earning assets and deposits. Management expects net
interest income to continue to grow and to be higher for full-
year 2006 compared with 2005.
NET INTEREST MARGIN
The net interest margin was 3.00% for 2005, a decline of 22
basis points compared with 2004. The following factors
contributed to the decline in net interest margin in 2005:
• An increase in the average rate paid on deposits of
93 basis points for 2005 compared with 2004. The
average rate paid on money market accounts, the
largest single component of interest-bearing
deposits, increased 130 basis points, reflecting the
increases in short-term interest rates that began in
mid-2004.
• An increase in the average rate paid on borrowed
funds of 131 basis points for 2005 compared with
2004.
• By comparison, the yield on interest-earning assets
increased 68 basis points.
• Higher balances of interest-earning trading assets for
2005, which negatively affected the overall yield on
interest-earning assets.
The factors above were partially offset by the favorable
impact on net interest margin in 2005 of an increase of 15
basis points related to noninterest-bearing sources of
funding. See Consolidated Income Statement Review under
the 2004 Versus 2003 section of Item 7 of this Report for
further information regarding 2003 taxable-equivalent net
interest income and margin.
PROVISION FOR CREDIT LOSSES
The provision for credit losses decreased $31 million, to $21
million, for 2005 compared with 2004. The decline in the
provision for credit losses was primarily due to the benefit
of a $53 million loan recovery in the second quarter of 2005
resulting from a litigation settlement, in addition to
continued strong asset quality. The favorable impact of
thes e factors on the provision was partially offset by the
impact of total average loan and loan commitments growth
in 2005 compared with the prior year.
We expect loan and loan commitment growth to continue to
impact the provision during 2006. In addition, we do not
expect to sustain asset quality at its current level and we
expect a higher provision for credit losses in 2006.
However, based on the assets we currently hold and current
business trends and activities, we believe that overall asset
quality will remain strong for at least the near term.
See the Credit Risk Management portion of the Risk
Management section of Item 7 for additional information
regarding factors impacting the provision for credit losses.
Also see Allowances For Loan And Lease Losses And
Unfunded Loan Commitments And Letters of Credit in that
Credit Risk Management section for additional information
regarding factors impacting the provision for credit losses.
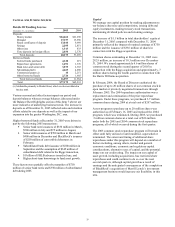
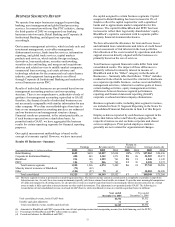
NONINTEREST INCOME
Summary
Noninterest income was $4.162 billion for 2005, an increase
of $599 million compared with 2004. Higher asset
management fees was the largest factor in the increase,
driven largely by BlackRock’ s acquisition of SSRM in
January 2005 and higher performance fees. In addition,
noninterest income in 2005 re flected increases in all other
major categories other than net securities losses in 2005
compared with net gains in 2004. We expect that the
increase in our ownership in the Merchant Services business
and the impact of the Harris Williams acquisition will have
a positive impact on noninterest income in 2006.
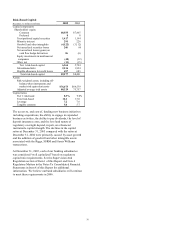
Additional analysis
Combined asset management and fund servicing fees
amounted to $2.313 billion for 2005 compared with $1.811
billion for 2004. The increase reflected the impact of the
first quarter 2005 SSRM acquisition, higher performance