PNC Bank 2005 Annual Report Download - page 51
Download and view the complete annual report
Please find page 51 of the 2005 PNC Bank annual report below. You can navigate through the pages in the report by either clicking on the pages listed below, or by using the keyword search tool below to find specific information within the annual report.-
 1
1 -
2
-
3
-
4
-
5
-
6
-
7
-
8
-
9
-
10
-
11
-
12
-
13
-
14
-
15
-
16
-
17
-
18
-
19
-
20
-
21
-
22
-
23
-
24
-
25
-
26
-
27
-
28
-
29
-
30
-
31
-
32
-
33
-
34
-
35
-
36
-
37
-
38
-
39
-
40
-
 41
41 -
 42
42 -
 43
43 -
 44
44 -
 45
45 -
 46
46 -
 47
47 -
 48
48 -
 49
49 -
 50
50 -
 51
51 -
 52
52 -
 53
53 -
 54
54 -
 55
55 -
 56
56 -
 57
57 -
 58
58 -
 59
59 -
 60
60 -
 61
61 -
62
-
63
-
64
-
65
-
66
-
67
-
68
-
69
-
70
-
71
-
72
-
73
-
74
-
75
-
76
-
77
-
78
-
79
-
80
-
81
-
82
-
83
-
84
-
85
-
86
-
87
-
88
-
89
-
90
-
91
-
92
-
93
-
94
-
95
-
96
-
97
-
98
-
99
-
100
-
101
-
102
-
103
-
104
-
105
-
106
-
107
-
108
-
109
-
110
-
111
-
112
-
113
-
114
-
115
-
116
-
117
-
118
-
119
-
120
-
121
-
122
-
123
-
124
-
125
-
126
-
127
-
128
-
129
-
130
-
131
-
132
-
133
-
134
-
135
-
136
-
137
-
138
-
139
-
140
-
141
-
142
-
143
-
144
-
145
-
146
-
147
-
148
-
149
-
150
-
151
-
152
-
153
-
154
-
155
-
156
-
157
-
158
-
159
-
160
-
161
-
162
-
163
-
164
-
165
-
166
-
167
-
168
-
169
-
170
-
171
-
172
-
173
-
174
-
175
-
176
-
177
-
178
-
179
-
180
-
181
-
182
-
183
-
184
-
185
-
186
-
187
-
188
-
189
-
190
-
191
-
192
-
193
-
194
-
195
-
196
-
197
-
198
-
199
-
200
-
201
-
202
-
203
-
204
-
205
-
206
-
207
-
208
-
209
-
210
-
211
-
212
-
213
-
214
-
215
-
216
-
217
-
218
-
219
-
220
-
221
-
222
-
223
-
224
-
225
-
226
-
227
-
228
-
229
-
230
-
231
-
232
-
233
-
234
-
235
-
236
-
237
-
238
-
239
-
240
-
241
-
242
-
243
-
244
-
245
-
246
-
247
-
248
-
249
-
250
-
251
-
252
-
253
-
254
-
255
-
256
-
257
-
258
-
259
-
260
-
261
-
262
-
263
-
264
-
265
-
266
-
267
-
268
-
269
-
270
-
271
-
272
-
273
-
274
-
275
-
276
-
277
-
278
-
279
-
280
-
281
-
282
-
283
-
284
-
285
-
286
-
287
-
288
-
289
-
290
-
291
-
292
-
293
-
294
-
295
-
296
-
297
-
298
-
299
-
300
 |
 |
51
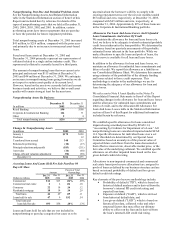
Interest Sensitivity Analysis
Dec. 31 Dec. 31
2005 2004
Net Interest Income Sensitivity Simulation
Effect on net interest income in first year
from gradual interest rate change over
following 12 months of:
100 basis point increase (.5)%
.6%
100 basis point decrease .2% (1.2)%
Effect on net interest income in second
year from gradual interest rate change
over the preceding 12 months of:
100 basis point increase (1.2)%
3.6%
100 basis point decrease (1.1)%
(6.6)%
Duration of Equity Model
Base case duration of equity (in years): .3 (1.5)
Key Period-End Interest Rates
One month LIBOR 4.39% 2.40%
Three-year swap 4.84% 3.66%
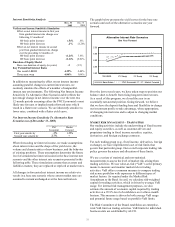
In addition to measuring the effect on net interest income
assuming parallel changes in current interest rates, we
routinely simulate the effects of a number of nonparallel
interest rate environments. The following Net Interest Income
Sensitivity To Alternative Rate Scenarios table reflects the
percentage change in net interest income over the next two
12-month periods assuming either the PNC Economist’ s most
likely rate forecast or implied market forward rates which
result in a flatter rate scenario. We are inherently sensitive to
lower rates, combined with a flatter yield curve.
Net Interest Income Sensitivity To Alternative Rate
Scenarios (as of December 31, 2005)
PNC
Economist
Market
Forward
First year sensitivity .1% (.1)%
Second year sensitivity 2.7% --
When forecasting net interest income, we make assumptions
about interest rates and the shape of the yield curve, the
volume and characteristics of new business, and the behavior
of existing positions. These assumptions determine the future
level of simulated net interest income in the base interest rate
scenario and the other interest rate scenarios presented in the
following table. These simulations assume that as assets and
liabilities mature, they are replaced or repriced at market rates.
All changes in forecasted net interest income are relative to
results in a base rate scenario where current market rates are
assumed to remain unchanged over the forecast horizon.
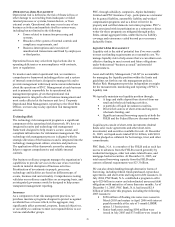
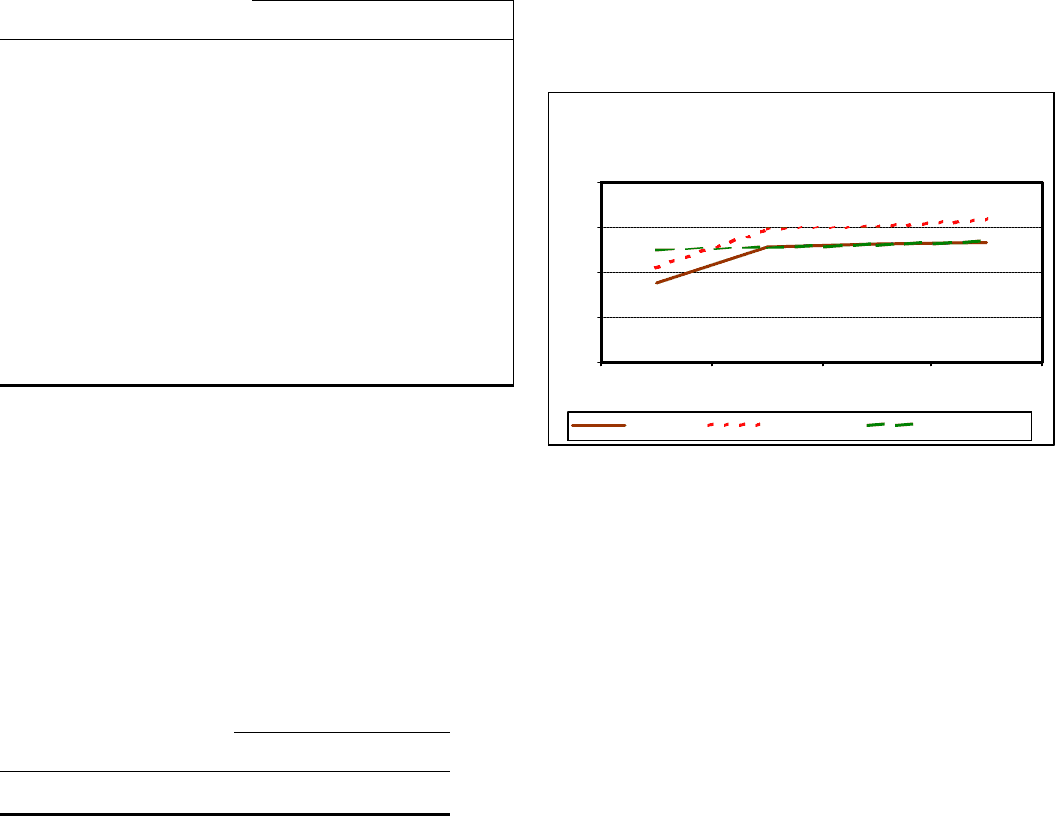
The graph below presents the yield curves for the base rate
scenario and each of the alternative scenarios one year
forward.
Over the last several years, we have taken steps to position our
balance sheet to benefit from rising long-term interest rates.
As a result of this program, we closed the year in an
essentially rate-neutral position. Going forward, we believe
that we have the deposit funding base and flexibility to change
our investment profile to take advantage, where appropriate,
of changing interest rates and to adjust to changing market
conditions.
MARKET RISK MANAGEMENT – TRADING RISK
Our trading activities include the underwriting of fixed income
and equity securities, as well as customer-driven and
proprietary trading in fixed income securities, equities,
derivatives, and foreign exchange contracts.
For each trading group (e.g., fixed income, derivatives, foreign
exchange), we have implemented a set of risk limits that
govern that particular group. Our overall corporate trading risk
policy governs the nature and allocation of these limits.
We use a variety of statistical and non-statistical
measurements to assess the level of market risk arising from
trading activities. We use value-at-risk (“VaR”) as the primary
means to measure and monitor market risk in trading
activities. VaR offers a common measure to compare trading
risk across portfolios with exposures to different types of
market factors. As required under the Market Risk
Amendment to the Basel Accord, we calculate risk-weighted
capital for trading activities, which is driven by average VaR
usage. For internal risk management purposes, we also
estimate the amount of economic capital required by trading
activities at a 99.9% level of confidence over a three-month
horizon. This measure is driven by both average VaR usage
and potential future usage based on portfolio VaR limits.
The Risk Committee of the Board establishes an enterprise-
wide VaR limit on trading activities. VaR limits for individual
business units are established by ALCO.
Alternative Interest Rate Scenarios
One Year Forward
3.50
4.00
4.50
5.00
5.50
1M LIBOR 2Y Swap 3Y Swap 5Y Swap
Base Rates PNC Economist Market Forward