PNC Bank 2005 Annual Report Download - page 117
Download and view the complete annual report
Please find page 117 of the 2005 PNC Bank annual report below. You can navigate through the pages in the report by either clicking on the pages listed below, or by using the keyword search tool below to find specific information within the annual report.-
 1
1 -
2
-
3
-
4
-
5
-
6
-
7
-
8
-
9
-
10
-
11
-
12
-
13
-
14
-
15
-
16
-
17
-
18
-
19
-
20
-
21
-
22
-
23
-
24
-
25
-
26
-
27
-
28
-
29
-
30
-
31
-
32
-
33
-
34
-
35
-
36
-
37
-
38
-
39
-
40
-
41
-
42
-
43
-
44
-
45
-
46
-
47
-
48
-
49
-
50
-
51
-
52
-
53
-
54
-
55
-
56
-
57
-
58
-
59
-
60
-
61
-
62
-
63
-
64
-
65
-
66
-
67
-
68
-
69
-
70
-
71
-
72
-
73
-
74
-
75
-
76
-
77
-
78
-
79
-
80
-
81
-
82
-
83
-
84
-
85
-
86
-
87
-
88
-
89
-
90
-
91
-
92
-
93
-
94
-
95
-
96
-
97
-
98
-
99
-
100
-
101
-
102
-
103
-
104
-
105
-
106
-
 107
107 -
 108
108 -
 109
109 -
 110
110 -
 111
111 -
 112
112 -
 113
113 -
 114
114 -
 115
115 -
 116
116 -
 117
117 -
 118
118 -
 119
119 -
 120
120 -
 121
121 -
 122
122 -
 123
123 -
 124
124 -
 125
125 -
 126
126 -
 127
127 -
128
-
129
-
130
-
131
-
132
-
133
-
134
-
135
-
136
-
137
-
138
-
139
-
140
-
141
-
142
-
143
-
144
-
145
-
146
-
147
-
148
-
149
-
150
-
151
-
152
-
153
-
154
-
155
-
156
-
157
-
158
-
159
-
160
-
161
-
162
-
163
-
164
-
165
-
166
-
167
-
168
-
169
-
170
-
171
-
172
-
173
-
174
-
175
-
176
-
177
-
178
-
179
-
180
-
181
-
182
-
183
-
184
-
185
-
186
-
187
-
188
-
189
-
190
-
191
-
192
-
193
-
194
-
195
-
196
-
197
-
198
-
199
-
200
-
201
-
202
-
203
-
204
-
205
-
206
-
207
-
208
-
209
-
210
-
211
-
212
-
213
-
214
-
215
-
216
-
217
-
218
-
219
-
220
-
221
-
222
-
223
-
224
-
225
-
226
-
227
-
228
-
229
-
230
-
231
-
232
-
233
-
234
-
235
-
236
-
237
-
238
-
239
-
240
-
241
-
242
-
243
-
244
-
245
-
246
-
247
-
248
-
249
-
250
-
251
-
252
-
253
-
254
-
255
-
256
-
257
-
258
-
259
-
260
-
261
-
262
-
263
-
264
-
265
-
266
-
267
-
268
-
269
-
270
-
271
-
272
-
273
-
274
-
275
-
276
-
277
-
278
-
279
-
280
-
281
-
282
-
283
-
284
-
285
-
286
-
287
-
288
-
289
-
290
-
291
-
292
-
293
-
294
-
295
-
296
-
297
-
298
-
299
-
300
 |
 |

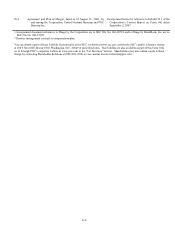
117
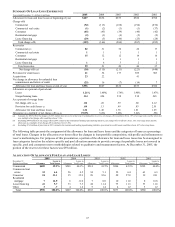
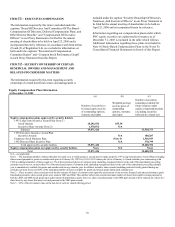
SUMMARY OF LOAN LOSS EXPERIENCE
Year ended December 31 - dollars in millions 2005 2004 2003 2002 2001
Allowance for loan and lease losses at beginning of year $607 $632 $673 $560 $598
Charge-offs
Commercial (52) (113) (168) (194) (876)
Commercial real estate (1) (2) (3) (3) (37)
Consumer (45) (43) (39) (40) (42)
Residential mortgage (2) (3) (4) (5) (2)
Lease financing (29) (5) (46) (25) (28)
Total charge-offs (129) (166) (260) (267) (985)
Recoveries
Commercial (a) 82 31 32 26 17
Commercial real estate 1 1 1 1 1
Consumer 15 12 12 14 16
Residential mortgage 1 1 1 1
Lease financing 1 6 3 2 2
Total recoveries 99 51 49 44 37
Net charge-offs (a) (30) (115) (211) (223) (948)
Provision for credit losses 21 52 177 309 903
Acquisitions 23 22 41
Net change in allowance for unfunded loan
commitments and letters of credit (25) 16 (7) (14) 7
Allowance for loan and lease losses at end of year $596 $607 $632 $673 $560
Allowance as a percent of period-end
Loans 1.21%
1.40%
1.74% 1.90% 1.47%
Nonperforming loans 314 424 238 218 265
As a percent of average loans
Net charge-offs (a) (b) .06 .28 .59 .60 2.12
Provision for credit losses (c) .04 .13 .49 .83 2.01
Allowance for loan and lease losses 1.26 1.48 1.76 1.81 1.25
Allowance as a multiple of net charge-offs (a) (b) 19.87x 5.28x 3.00x 3.02x .59x
(a) Amounts for 2005 reflect the impact of a $53 million loan recovery in that year. Excluding this recovery, net charge-offs would have been .18% of average loans and the allowance
as a multiple of net charge-offs would have been 7.18x.
(b) Excluding $804 million of net charge-offs in 2001 related to the institutional lending repositioning initiative, net charge-offs would have been .32% of average loans and the
allowance as a multiple of net charge-offs would have been 3.89x.
(c) Excluding $714 million of provision in 2001 related to the institutional lending repositioning initiative, provision for credit losses would have been .42% of average loans.
The following table presents the assignment of the allowance for loan and lease losses and the categories of loans as a percentage
of total loans. Changes in the allocation over time reflect the changes in loan portfolio composition, risk profile and refinements to
reserve methodologies. For purposes of this presentation, a portion of the allowance for loan and lease losses has been assigned to
loan categories based on the relative specific and pool allocation amounts to provide coverage for probable losses not covered in
specific, pool and consumer reserve methodologies related to qualitative and measurement factors. At December 31, 2005, the
portion of the reserves for these factors was $59 million.
ALLOCATION OF ALLOWANCE FOR LOAN AND LEASE LOSSES
2005
2004
2003
2002
2001
December 31
Dollars in millions
Allowance
Loans to
Total Loans
Allowance
Loans to
Total Loans Allowance
Loans to
Total Loans
Allowance
Loans to
Total Loans Allowance
Loans to
Total Loans
Commercial $489 39.2% $503 40.1% $514 41.5% $504 42.3% $392 40.0%
Commercial real
estate 32 6.4 26 4.5 34 5.1 52 6.4 63 6.3
Consumer
24
33.1
35
35.9
28
32.6
28
27.8
39
24.1
Residential
mortgage 7 14.9 6 11.0 7 8.0 10 11.0 8 16.8
Lease financing 41 5.7 33 7.3 44 11.4 75 11.3 53 11.6
Other 3 .7 4 1.2 5 1.4 4 1.2 5 1.2
Total $596 100.0% $607 100.0% $632 100.0% $673 100.0% $560 100.0%