PNC Bank 2005 Annual Report Download - page 36
Download and view the complete annual report
Please find page 36 of the 2005 PNC Bank annual report below. You can navigate through the pages in the report by either clicking on the pages listed below, or by using the keyword search tool below to find specific information within the annual report.-
 1
1 -
2
-
3
-
4
-
5
-
6
-
7
-
8
-
9
-
10
-
11
-
12
-
13
-
14
-
15
-
16
-
17
-
18
-
19
-
20
-
21
-
22
-
23
-
24
-
25
-
 26
26 -
 27
27 -
 28
28 -
 29
29 -
 30
30 -
 31
31 -
 32
32 -
 33
33 -
 34
34 -
 35
35 -
 36
36 -
 37
37 -
 38
38 -
 39
39 -
 40
40 -
 41
41 -
 42
42 -
 43
43 -
 44
44 -
 45
45 -
 46
46 -
47
-
48
-
49
-
50
-
51
-
52
-
53
-
54
-
55
-
56
-
57
-
58
-
59
-
60
-
61
-
62
-
63
-
64
-
65
-
66
-
67
-
68
-
69
-
70
-
71
-
72
-
73
-
74
-
75
-
76
-
77
-
78
-
79
-
80
-
81
-
82
-
83
-
84
-
85
-
86
-
87
-
88
-
89
-
90
-
91
-
92
-
93
-
94
-
95
-
96
-
97
-
98
-
99
-
100
-
101
-
102
-
103
-
104
-
105
-
106
-
107
-
108
-
109
-
110
-
111
-
112
-
113
-
114
-
115
-
116
-
117
-
118
-
119
-
120
-
121
-
122
-
123
-
124
-
125
-
126
-
127
-
128
-
129
-
130
-
131
-
132
-
133
-
134
-
135
-
136
-
137
-
138
-
139
-
140
-
141
-
142
-
143
-
144
-
145
-
146
-
147
-
148
-
149
-
150
-
151
-
152
-
153
-
154
-
155
-
156
-
157
-
158
-
159
-
160
-
161
-
162
-
163
-
164
-
165
-
166
-
167
-
168
-
169
-
170
-
171
-
172
-
173
-
174
-
175
-
176
-
177
-
178
-
179
-
180
-
181
-
182
-
183
-
184
-
185
-
186
-
187
-
188
-
189
-
190
-
191
-
192
-
193
-
194
-
195
-
196
-
197
-
198
-
199
-
200
-
201
-
202
-
203
-
204
-
205
-
206
-
207
-
208
-
209
-
210
-
211
-
212
-
213
-
214
-
215
-
216
-
217
-
218
-
219
-
220
-
221
-
222
-
223
-
224
-
225
-
226
-
227
-
228
-
229
-
230
-
231
-
232
-
233
-
234
-
235
-
236
-
237
-
238
-
239
-
240
-
241
-
242
-
243
-
244
-
245
-
246
-
247
-
248
-
249
-
250
-
251
-
252
-
253
-
254
-
255
-
256
-
257
-
258
-
259
-
260
-
261
-
262
-
263
-
264
-
265
-
266
-
267
-
268
-
269
-
270
-
271
-
272
-
273
-
274
-
275
-
276
-
277
-
278
-
279
-
280
-
281
-
282
-
283
-
284
-
285
-
286
-
287
-
288
-
289
-
290
-
291
-
292
-
293
-
294
-
295
-
296
-
297
-
298
-
299
-
300
 |
 |
36
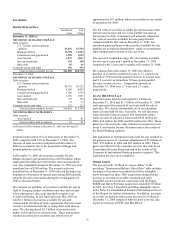
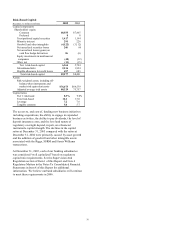
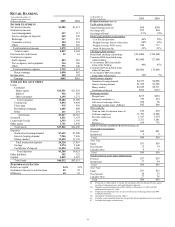
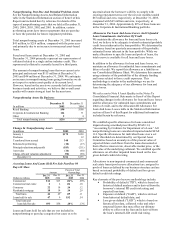
• Average residential mortgage loans increased $517
million, or 58%, primarily due to the addition of
loans from the greater Washington, D.C. area
acquisition. Payoffs in our existing portfolio, which
will continue throughout 2006, reduced the impact of
the additional loans acquired.
Growing core checking deposits as a lower cost-funding
source and as the cornerstone product to build customer
relationships are primary objectives of our deposit strategy.
Average total deposits increased $3.9 billion, or 10% ,
compared with 2004. The deposit growth was driven by
increases in the number of checking relationships (new
customer acquisition and the expansion into the greater
Washington, D.C. area) and the recapture of consumer
certificate of deposit balances as interest rates have risen.
During this rising rate environment, we expect the rate of
growth in demand deposit balances to be less than the rate of
growth for customer checking relationships. Additionally, we
expect to see customers shift their funds from lower interest-
bearing deposits to higher yielding deposits or investment
products. The shift was evident during the second half of 2005
and impacted the level of average demand deposits in that
period. Higher energy costs to consumers could also have a
negative impact on demand deposit balance growth.
• Average demand deposit growth of $909 million, or 6%,
was driven by a $229 million increase in the core business
due to continued growth in total checking relationships
and $680 million attributable to the expansion into the
greater Washington, D.C. area.
• Small business checking relationship retention has
improved. Consumer checking relationship retention
remains steady and strong due to increased penetration
rates of debit card, online banking and online bill
payment.
• Customer balances in other deposit products remained
consistent while certificates of deposits increased $2.5
billion. This increase was attributable to the rising
interest rate environment attracting customers back into
this product.
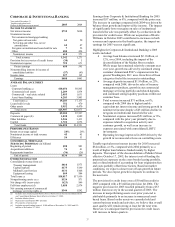
Assets under management of $49 billion at December 31,
2005 declined $1 billion compared with the balance at
December 31, 2004. The effects of comparatively higher
equity markets and the expansion into the greater Washington,
D.C. area were more than offset by net client asset outflows.
Net client asset outflows are the result of ordinary course
distributions from trust and investment management accounts
and account closures exceeding investment additions from
new and existing clients. The net outflows were primarily
related to a few significant low-margin clients.
Nondiscretionary assets under administration of $84 billion at
December 31, 2005 declined $9 billion compared with the
balance at December 31, 2004. The decline primarily reflects
the loss of two sizeable master custody accounts with minimal
earnings impact.
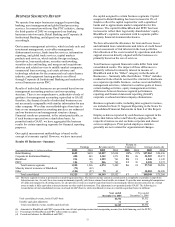
Retail Banking provides deposit, lending, cash management,
brokerage, investment management and trust, and private
banking products and services to 2.5 million customers within
our primary geographic area. Products and services offered to
our customers include:
• Checking accounts
• Savings, money market and certificates of deposit
• Personal and business loans
• Cash management, collection and payment services
• Brokerage and insurance services
• Personal and charitable trusts
• Executorships
• Employee benefit plans
• Investment management