PNC Bank 2005 Annual Report Download - page 33
Download and view the complete annual report
Please find page 33 of the 2005 PNC Bank annual report below. You can navigate through the pages in the report by either clicking on the pages listed below, or by using the keyword search tool below to find specific information within the annual report.-
 1
1 -
2
-
3
-
4
-
5
-
6
-
7
-
8
-
9
-
10
-
11
-
12
-
13
-
14
-
15
-
16
-
17
-
18
-
19
-
20
-
21
-
22
-
 23
23 -
 24
24 -
 25
25 -
 26
26 -
 27
27 -
 28
28 -
 29
29 -
 30
30 -
 31
31 -
 32
32 -
 33
33 -
 34
34 -
 35
35 -
 36
36 -
 37
37 -
 38
38 -
 39
39 -
 40
40 -
 41
41 -
 42
42 -
 43
43 -
44
-
45
-
46
-
47
-
48
-
49
-
50
-
51
-
52
-
53
-
54
-
55
-
56
-
57
-
58
-
59
-
60
-
61
-
62
-
63
-
64
-
65
-
66
-
67
-
68
-
69
-
70
-
71
-
72
-
73
-
74
-
75
-
76
-
77
-
78
-
79
-
80
-
81
-
82
-
83
-
84
-
85
-
86
-
87
-
88
-
89
-
90
-
91
-
92
-
93
-
94
-
95
-
96
-
97
-
98
-
99
-
100
-
101
-
102
-
103
-
104
-
105
-
106
-
107
-
108
-
109
-
110
-
111
-
112
-
113
-
114
-
115
-
116
-
117
-
118
-
119
-
120
-
121
-
122
-
123
-
124
-
125
-
126
-
127
-
128
-
129
-
130
-
131
-
132
-
133
-
134
-
135
-
136
-
137
-
138
-
139
-
140
-
141
-
142
-
143
-
144
-
145
-
146
-
147
-
148
-
149
-
150
-
151
-
152
-
153
-
154
-
155
-
156
-
157
-
158
-
159
-
160
-
161
-
162
-
163
-
164
-
165
-
166
-
167
-
168
-
169
-
170
-
171
-
172
-
173
-
174
-
175
-
176
-
177
-
178
-
179
-
180
-
181
-
182
-
183
-
184
-
185
-
186
-
187
-
188
-
189
-
190
-
191
-
192
-
193
-
194
-
195
-
196
-
197
-
198
-
199
-
200
-
201
-
202
-
203
-
204
-
205
-
206
-
207
-
208
-
209
-
210
-
211
-
212
-
213
-
214
-
215
-
216
-
217
-
218
-
219
-
220
-
221
-
222
-
223
-
224
-
225
-
226
-
227
-
228
-
229
-
230
-
231
-
232
-
233
-
234
-
235
-
236
-
237
-
238
-
239
-
240
-
241
-
242
-
243
-
244
-
245
-
246
-
247
-
248
-
249
-
250
-
251
-
252
-
253
-
254
-
255
-
256
-
257
-
258
-
259
-
260
-
261
-
262
-
263
-
264
-
265
-
266
-
267
-
268
-
269
-
270
-
271
-
272
-
273
-
274
-
275
-
276
-
277
-
278
-
279
-
280
-
281
-
282
-
283
-
284
-
285
-
286
-
287
-
288
-
289
-
290
-
291
-
292
-
293
-
294
-
295
-
296
-
297
-
298
-
299
-
300
 |
 |

33
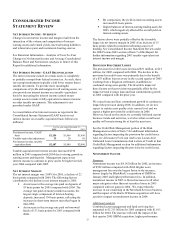
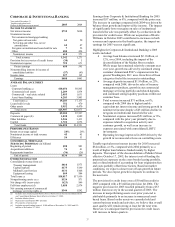
BUSINESS SEGMENTS REVIEW
We operate four major businesses engaged in providing
banking, asset management and global fund processing
services. In connection with our One PNC initiative, during
the third quarter of 2005 we reorganized our banking
businesses into two units, Retail Banking and Corporate &
Institutional Banking, and aligned our reporting
accordingly.
Our treasury management activities, which include cash and
investment management, receivables management,
disbursement services, funds transfer services, information
reporting, and global trade services; capital markets
products and services, which include foreign exchange,
derivatives, loan syndications, securities underwriting,
securities sales and trading, and mergers and acquisitions
advisory and related services to middle-market companies;
commercial loan servicing, real estate advisory and
technology solutions for the commercial real estate finance
industry; and equipment leasing products are offered
through Corporate & Institutional Banking and marketed by
several businesses across PNC.
Results of individual businesses are presented based on our
management accounting practices and our operating
structure. There is no comprehensive, authoritative body of
guidance for management accounting equivalent to GAAP;
therefore, the financial results of individual businesses are
not necessarily comparable with similar information for any
other company. We refine our methodologies from time to
time as our management accounting practices are enhanced
and our businesses and management structure change.
Financial results are presented, to the extent practicable, as
if each business operated on a stand-alone basis. As
permitted under GAAP, we have aggregated the business
results for certain operating segments for financial reporting
purposes.
Our capital measurement methodology is based on the
concept of economic capital. However, we have increased
the capital assigned to certain business segments. Capital
assigned to Retail Banking has been increased to 6% of
funds to reflect the capital required for well-capitalized
banks and to approximate market comparables for this
business. The capital for BlackRock and PFPC has been
increased to reflect their legal entity shareholders’ equity.
BlackRock’ s capital is consistent with its separate public
company financial statement disclosures.
We have allocated the allowance for loan and lease losses
and unfunded loan commitments and letters of credit based
on our assessment of risk inherent in the loan portfolios.
Our allocation of the costs incurred by operations and other
support areas not directly aligned with the businesses is
primarily based on the use of services.
Total business segment financial results differ from total
consolidated results. The impact of these differences is
primarily reflected in minority interest in income of
BlackRock and in the “Other” category in the Results of
Businesses – Summary table that follows. “Other” includes
residual activities that do not meet the criteria for disclosure
as a separate reportable business, such as asset and liability
management activities, related net securities gains or losses,
certain trading activities, equity management activities,
differences between business segment performance
reporting and financial statement reporting (GAAP),
corporate overhead and intercompany eliminations.
Business segment results, including inter-segment revenues,
are included in Note 21 Segment Reporting in the Notes To
Consolidated Financial Statements in Item 8 of this Report.
Employee data as reported by each business segment in the
tables that follow reflect staff directly employed by the
respective busines ses and excludes corporate and shared
services employees. Prior period employee statistics
generally are not restated for organizational changes.
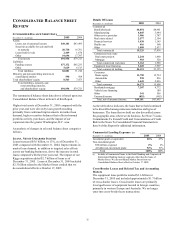
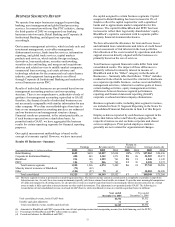
Results Of Businesses - Summary
Return on
Earnings Revenue (a) (b) Capital (c) Average Assets (d)
Year ended December 31 - dollars in millions
2005
2004
2005
2004
2005
2004
2005
2004
Retail Banking $682 $610 $2,857 $2,694
24%
23% $27,862 $24,496
Corporate & Institutional Banking 480 443 1,342 1,271 28 26 25,907 22,073
BlackRock 234 143 1,229 761 28 19 1,848 1,145
PFPC 104 70 846 763 32 30 2,128 2,572
Total business segments 1,500 1,266 6,274 5,489 26 24 57,745 50,286
Minority interest in income of BlackRock (71) (42)
Other (104) (27) 75 63 30,803 24,980
Total consolidated $1,325 $1,197 $6,349 $5,552 17 17 $88,548 $75,266
(a) Business segment revenue is presented on a taxable-equivalent basis. The interest income earned on certain assets is completely or partially exempt from
federal income t ax. As such, these tax-exempt instruments typically yield lower returns than a taxable investment. To provide more meaningful comparisons
of yields and margins for all earning assets, we also provide revenue on a taxable-equivalent basis by increasing the interest income earned on tax-exempt
assets to make it fully equivalent to interest income on other taxable investments. This adjustment is not permitted under GAAP. The following is a
reconciliation of total consolidated revenue on a book (GAAP) basis to total consolidated revenue on a taxable-equivalent basis (in millions):
Year ended
Year ended
December 31, 2005
December 31, 2004
Total consolidated revenue, book (GAAP) basis $6,316
$5,532
Taxable-equivalent adjustment 33
20
Total consolidated revenue, taxable-equivalent basis $6,349
$5,552
(b) Amounts for BlackRock and PFPC represent the sum of total operating revenue and nonoperating income (less debt financing costs for PFPC).
(c) Percentages for BlackRock and PFPC reflect return on equity.
(d) Period-end balances for BlackRock and PFPC.